 Global| Aug 11 2009
U.S. Small Business Optimism Weakens Again As Hiring Intentions Remain Depressed
by:Tom Moeller
|in:Economy in Brief
Summary
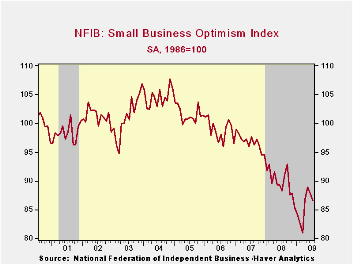
Times may be improving, but small business' sense of that has sagged of late. The National Federation of Independent Business (NFIB) indicated that for the second consecutive month small business optimism slipped. The July decline [...]
 Times
may be improving, but small business' sense of that has sagged of late.
The National Federation of Independent Business (NFIB) indicated that
for the second consecutive month small business optimism slipped. The
July decline from June to an index level of 86.5 was to the lowest
level since March. Moreover, the latest figure was down slightly from
last year though it remained well improved from the lows of this past
winter.
Times
may be improving, but small business' sense of that has sagged of late.
The National Federation of Independent Business (NFIB) indicated that
for the second consecutive month small business optimism slipped. The
July decline from June to an index level of 86.5 was to the lowest
level since March. Moreover, the latest figure was down slightly from
last year though it remained well improved from the lows of this past
winter.
During the last ten years, there has been a 49% correlation between the level of the NFIB index and the two-quarter change in real GDP.
The percentage planning to raise employment remained slightly negative and the percentage with one or more job openings slipped to just 9%, nearly the lowest since 1982. During the last ten years there has been a 71% correlation between the NFIB employment percentage and the y/y change in nonfarm payrolls.
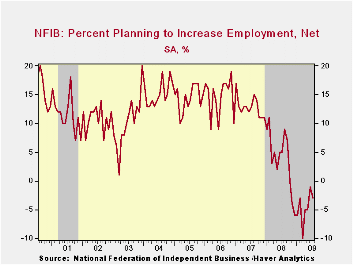 Driving
the cautious hiring was the falling percentage of small businesses
expecting the economy to improve, back to its lowest level since March.
The percentage expecting credit conditions to ease also remained in its
recent range while the percentage reporting that now is a good time to
expand business held in its modestly positive range of recent months.
Driving
the cautious hiring was the falling percentage of small businesses
expecting the economy to improve, back to its lowest level since March.
The percentage expecting credit conditions to ease also remained in its
recent range while the percentage reporting that now is a good time to
expand business held in its modestly positive range of recent months.
During the next 3-6 months, plans for capital spending also remained range-bound but modestly positive. This weakness in investment reflects not only diminished optimism about the economic outlook but poor profits. Forty-five percent of firms are reporting lower earnings this quarter versus last.
The largest, single most important problems seen by business were poor sales (32%), taxes (22%), government requirements (12%), insurance cost & availability (9%), competition from large businesses (5%) and inflation (3%).
The
percentage of firms planning to raise prices held
at 5% and that was near the record low. 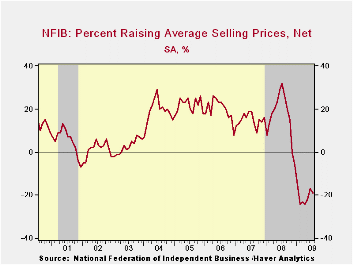 The
percentage of firms actually raising prices slipped
and remained in negative territory, near the record low.
During the last ten years there has been a 69% correlation between the
y/y change in the producer price index and the level of the NFIB price
index.
The
percentage of firms actually raising prices slipped
and remained in negative territory, near the record low.
During the last ten years there has been a 69% correlation between the
y/y change in the producer price index and the level of the NFIB price
index.
About 24 million small businesses exist in the United States. Small business creates 80% of all new jobs in America and the NFIB figures can be found in Haver's SURVEYS database.
Why Are Banks Holding So Many Excess Reserves? from the Federal Reserve Bank of New York can be found here.
| Nat'l Federation of Independent Business | July | June | Y/Y | 2008 | 2007 | 2006 |
|---|---|---|---|---|---|---|
| Small Business Optimism Index (SA, 1986=100) | 86.5 | 87.8 | -1.9% | 89.8 | 96.7 | 98.9 |
U.S. Worker Productivity JumpsDuring 2Q As Trend Improves
by Tom Moeller August 11, 2009
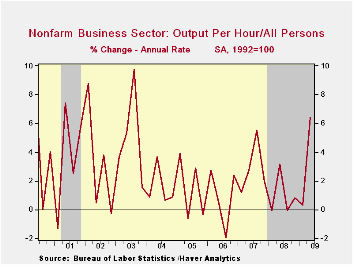 Businesses
have managed their businesses well for the weakened economic
environment. That's evident in the labor productivity gains during the
last three quarters which stand in sharp contrast to the material
declines during the economic downturns of the 1950s through the 1980s.
Last quarter, improved management of labor costs was evident in a 6.4%
(AR) surge in labor productivity in the nonfarm sector. It was the
strongest increase since the third quarter of 2003 and the gain beat
Consensus expectations for a 5.3% increase. (Revisions to past data incorporate
the comprehensive revisions to the National Income & Product
Accounts (NIPA) data that were reported on July 31st.
)
Businesses
have managed their businesses well for the weakened economic
environment. That's evident in the labor productivity gains during the
last three quarters which stand in sharp contrast to the material
declines during the economic downturns of the 1950s through the 1980s.
Last quarter, improved management of labor costs was evident in a 6.4%
(AR) surge in labor productivity in the nonfarm sector. It was the
strongest increase since the third quarter of 2003 and the gain beat
Consensus expectations for a 5.3% increase. (Revisions to past data incorporate
the comprehensive revisions to the National Income & Product
Accounts (NIPA) data that were reported on July 31st.
)
 Cuts to
employment & hours-worked
came in the face of a sharp output decline which totaled a record 5.6%
y/y. As evident in the recent GDP report, last quarter the quarterly
rate of business sector output decline slowed to 1.7% from 8.8% during
1Q. Nevertheless, businesses continued to cut employment &
hours worked sharply; at a 7.6% annual rate after a 9.0% drop during
1Q.· Compensation costs weakened substantially with the recession. They
barely rose at a 0.2% rate after the 2.4% 1Q decline. These weak
figures combined with downward revisions to earlier data leave the y/y
increase at just 1.3% which continues the downtrend from roughly 4.0%
growth back to 2001.
Cuts to
employment & hours-worked
came in the face of a sharp output decline which totaled a record 5.6%
y/y. As evident in the recent GDP report, last quarter the quarterly
rate of business sector output decline slowed to 1.7% from 8.8% during
1Q. Nevertheless, businesses continued to cut employment &
hours worked sharply; at a 7.6% annual rate after a 9.0% drop during
1Q.· Compensation costs weakened substantially with the recession. They
barely rose at a 0.2% rate after the 2.4% 1Q decline. These weak
figures combined with downward revisions to earlier data leave the y/y
increase at just 1.3% which continues the downtrend from roughly 4.0%
growth back to 2001.
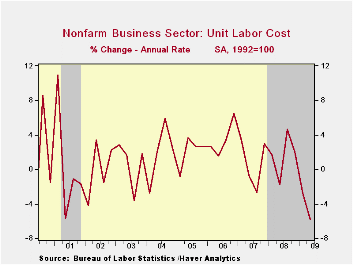
Last quarter, the surge in productivity and the moderation in labor cost growth combined to drop unit labor costs. The 5.8% q/q decline was the second in a row and lowered the y/y change to -0.6%, the first negative reading since early-2004.
Nowhere
was the productivity improvement more evident last quarter than in the
factory sector. 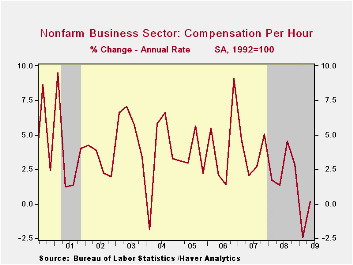 Worker productivity rose 5.3% which was the first
quarterly increase in over one year. Output fell at a 9.9% rate
(-15.0%) while hours worked dropped at a 14.4% rate (-13.9%). The
benefit to workers was seen in a 5.8% rise in 2Q compensation. That
rise lifted to y/y growth to 6.0% which was its strongest since 2003.
The combination of strong productivity and strong compensation kept the
quarterly increase in unit labor cost at just 0.5%. However,
year-to-year, growth of 7.4% y/y is a multiple of last year's 2.2%
growth.
Worker productivity rose 5.3% which was the first
quarterly increase in over one year. Output fell at a 9.9% rate
(-15.0%) while hours worked dropped at a 14.4% rate (-13.9%). The
benefit to workers was seen in a 5.8% rise in 2Q compensation. That
rise lifted to y/y growth to 6.0% which was its strongest since 2003.
The combination of strong productivity and strong compensation kept the
quarterly increase in unit labor cost at just 0.5%. However,
year-to-year, growth of 7.4% y/y is a multiple of last year's 2.2%
growth.
The productivity & cost figures are available in Haver's USECON database.
Investing over the life cycle with the long-run labor income risk from the Federal Reserve Bank of Chicago can be found here.
| Nonfarm Business Sector (SAAR, %) | 2Q '09 | 1Q '08 | Y/Y | 2008 | 2007 | 2006 |
|---|---|---|---|---|---|---|
| Output per Hour | 6.4 | 0.3 | 1.8 | 1.8 | 1.9 | 0.9 |
| Compensation per Hour | 1.2 | -2.4 | 1.3 | 2.8 | 4.2 | 3.8 |
| Unit Labor Costs | -5.8 | -2.7 | -0.6 | 1.0 | 2.3 | 2.8 |
Gasoline Prices Again Move Higher
by Tom Moeller August 11, 2009
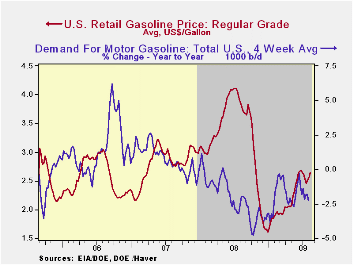
The economy must be improving if gasoline prices are rising. Or is it seasonal strength? The pump price for regular gasoline increased last week to an average $2.56 per gallon, though that still was down a nickel from last month's high. The increase added to the nearly one dollar (59%) rise from the December low. Yesterday, however, the pricing strength was even more evident with the twenty cent jump to $2.03 per gallon in the cash market price. Gasoline prices were up off the early-July low of $1.60. The figures are reported by the U.S. Department of Energy and can be found in Haver's WEEKLY & DAILY databases.
Crude oil prices also have strengthened.
Light sweet crude oil prices (WTI) increased to $67.23 per barrel and
they've roughly doubled this year. Yesterday the spot market price for
light sweet crude oil rose further to $71.58 per barrel. Prices had
reached a daily high of $72.68 earlier in July.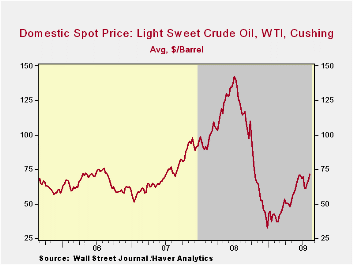
The pickup in energy prices is against the backdrop of a firming demand picture. It probably is seasonal, but during the last four weeks the demand for gasoline is up sharply. Year-to year, demand still is down by 1.8%, but that compares to a nearly 5% rate of decline last fall. Demand for distillate also is off sharply though residual fuel oil demand has moved higher. Finally, oil remains plentiful as evidenced by a 13.0% y/y rise in inventories of crude oil & petroleum products. Inventories of gasoline are flat y/y but crude oil inventories less the SPR are up by 17.8%. The figures on crude oil production and inventories are available in Haver's OILWKLY database.
Natural gas prices continued their move sideways last week. At an average of $3.44 per mmbtu (-62.8% y/y), the price was down by three-quarters from the high reached in early-July of last year of $13.19/mmbtu.
| Weekly Prices | 08/10/09 | 08/03/09 | Y/Y | 2008 | 2007 | 2006 |
|---|---|---|---|---|---|---|
| Retail Regular Gasoline ($ per Gallon, Regular) | 2.65 | 2.56 | -30.5% | 3.25 | 2.80 | 2.57 |
| Light Sweet Crude Oil, WTI ($ per bbl.) | 71.57 | 67.07 | -39.8% | 100.16 | 72.25 | 66.12 |
Japan Consumer Confidence Rises But Remains Short Of Being Even Neutral
by Robert Brusca August 11, 2009
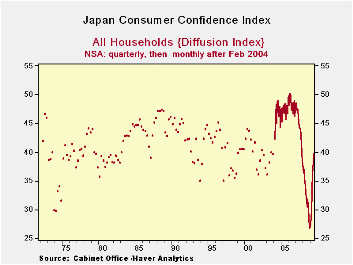
Japan paradox - The paradox of Japan’s consumer confidence is
that the index is over the 50 percent mark of its range. It also stands
right at its average level of readings going back to 1988. Even so this
is a diffusion index with 50 as the theoretical point of neutrality. At
a level of 39.4 we are instead at the average reading and at the
mid-point of the range of values of consumer confidence readings going
back about 20 years.
An unexpected standard - Since the economy usually is
expanding, we would expect the average of a figure like consumer
confidence to be above 50. But Japan has had some hard times during
this period including its so-called lost decade. As for the index range
we can’t be a so sure of its values or middle but a value near 50 also
seems likely. The readings on Japan confidence do not conform to
reasonable expectations. So instead so looking at this a diffusion
index with 50 as neutral we should look at it with its man value set as
neutral. In July 2009 the index stands at its mean reading –a mean
reading based on about 20-years of observations. Adjusted for its own
mean, therefore Japan’s confidence level has gotten to zero.
A better interpretation - Based on the plot of past values it
looks like Japan’s consumers are a relatively content when the index
resides between values of 50 and 45 on this index. So while the index
reading is back to its long term average that is not yet a good enough
spot. For now with some rise in machinery orders in hand it looks like
Japan’s economy is getting back on something more like an even keel.
Consumer prices are still falling so it’s too soon to say that Japan is
out of the woods. In last month’s report Japan was the last large OECD
economy still giving off negative readings on the OECD leading
indicators series. But seeing some firmness in consumer confidence does
give us some reason to take heart. Japan may be on the verge of turning
the corner to better times.
| Japan Consumer Confidence | Percentile | |||||||
|---|---|---|---|---|---|---|---|---|
| Monthly | Change over | Of Range* | ||||||
| Jul-09 | Jun-09 | May-09 | 3-mos | 6-mos | 12-Mos | Since 2004 | Since 1988 | |
| Overall Livelihood | 39.4 | 37.4 | 36.3 | 5.6 | 10.2 | 10.1 | 58.9 | 53.7 |
| Income growth | 37.0 | 35.8 | 35.3 | 3.6 | 5.6 | 0.7 | 38.8 | 28.5 |
| Employment | 34.0 | 31.7 | 28.0 | 10.7 | 19.8 | 3.3 | 48.3 | 48.3 |
| Willing to buy Durable Goods | 47.3 | 45.5 | 43.1 | 8.3 | 16.7 | 18.1 | 81.5 | 80.5 |
| Value of Assets | 37.8 | 37.6 | 35.9 | 5.6 | 9.7 | 2.9 | 46.6 | 46.6 |
| For two-person households; * Percentiles since Mar 2004 when series became monthly or full period | ||||||||
Latvia And Lithuania Report Improvement In Their Current Accounts
by Louise Curley August 11, 2009
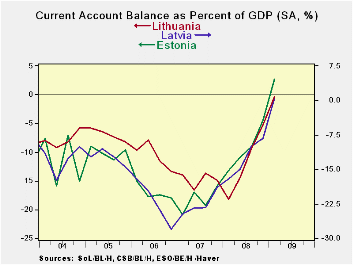 The Baltic States, Latvia,
Lithuania and Estonia have begun to
repair their current accounts deficits which had reached as high as
18-28% of GDP . The first chart shows the current accounts as a percent
of GDP for the three countries.
The Baltic States, Latvia,
Lithuania and Estonia have begun to
repair their current accounts deficits which had reached as high as
18-28% of GDP . The first chart shows the current accounts as a percent
of GDP for the three countries.
Today Latvia and Lithuania released balance of payments data
for June. Both countries show a continuation of the current account
surplus that started in February of this year, as shown in the second
chart.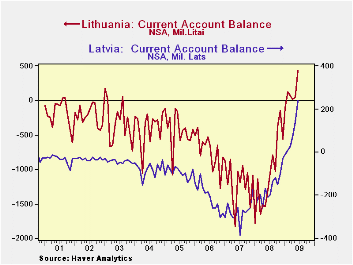 In Latvia, it has been the surplus on income that has accounted
for much of the current account surplus. However, there has also been a
declining deficit on goods and services and finally a surplus in June.
The balance on current transfers has been small and has had little
effect on the overall current balance. The third chart shows the trends
in the income and goods and services balances for Latvia.
In Latvia, it has been the surplus on income that has accounted
for much of the current account surplus. However, there has also been a
declining deficit on goods and services and finally a surplus in June.
The balance on current transfers has been small and has had little
effect on the overall current balance. The third chart shows the trends
in the income and goods and services balances for Latvia.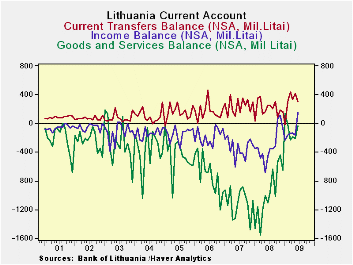
In Lithuania, the trends are less clear. The income balance
only turned positive in June and the balance on goods and services
remains in deficit. However, in contrast to Latvia, current transfers
have been the major factor accounting for the surplus on current
account, as can be seen in the fourth chart.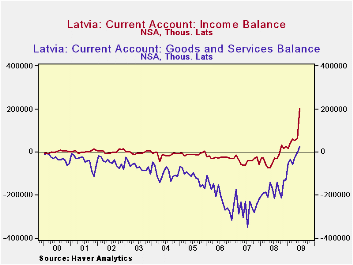
| Jun 09 | May 09 | Apr 09 | Mar09 | Feb 09 | |
|---|---|---|---|---|---|
| Latvia (Thousand Lats) | |||||
| Current Account | 237.73 | 139.18 | 73.97 | 27.04 | 8.89 |
| Goods and Service Balance | 23698 | -2584 | -23448 | -58220 | -33661 |
| Income Balance | 201894 | 63640 | 53676 | 58454 | 42749 |
| Lithuania (Mil Litai) | |||||
| Current Account | 424.86 | 47.06 | 10.79 | 62.05 | 124.66 |
| Goods and Service Balance | -32.41 | -210.29 | -192.79 | -228.63 | -19.09 |
| Income Balance | 150.83 | -158.45 | -138.59 | -146.09 | -163.31 |
| Current Transfers306.07 | 306.07 | 415.80 | 337.17 | 436.77 | 307.06 |

Tom Moeller
AuthorMore in Author Profile »Prior to joining Haver Analytics in 2000, Mr. Moeller worked as the Economist at Chancellor Capital Management from 1985 to 1999. There, he developed comprehensive economic forecasts and interpreted economic data for equity and fixed income portfolio managers. Also at Chancellor, Mr. Moeller worked as an equity analyst and was responsible for researching and rating companies in the economically sensitive automobile and housing industries for investment in Chancellor’s equity portfolio. Prior to joining Chancellor, Mr. Moeller was an Economist at Citibank from 1979 to 1984. He also analyzed pricing behavior in the metals industry for the Council on Wage and Price Stability in Washington, D.C. In 1999, Mr. Moeller received the award for most accurate forecast from the Forecasters' Club of New York. From 1990 to 1992 he was President of the New York Association for Business Economists. Mr. Moeller earned an M.B.A. in Finance from Fordham University, where he graduated in 1987. He holds a Bachelor of Arts in Economics from George Washington University.
More Economy in Brief


