 Global| Oct 31 2008
U.S. September Income Rose, Spending Fell: Trend Growth of Both Down
by:Tom Moeller
|in:Economy in Brief
Summary
During September nominal personal income rose 0.2%, just half the revised 0.4% August increase. Moreover, a slowing growth trend was evident in the y/y gain of 3.9% which was down sharply from last year's 6.1% rise and the 7.1% [...]
During September nominal personal income rose 0.2%, just half the revised 0.4% August increase. Moreover, a slowing growth trend was evident in the y/y gain of 3.9% which was down sharply from last year's 6.1% rise and the 7.1% increase during 2006. The September increase in personal income exceeded Consensus expectations for a 0.1% rise.
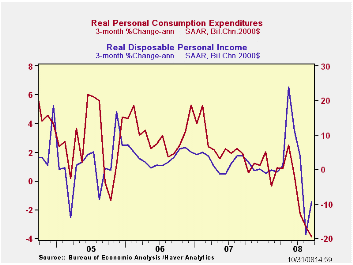
Disposable personal income rose 0.2% last month after 1.0%-to-1.8% declines during the prior three months. They occurred due to the absence of tax rebate checks. Weaker job gains have slowed trend growth to 4.2% y/y after last year's rise of 5.5% and 6.4% during 2006.
Weaker gains in wage & salary income very much reflect
the soft jobs environment. Wages rose 0.1% last month, up 3.4% y/y.
Three month growth of 3.1% (AR) was considerably below the 9.8% rate of
growth early last year. Factory sector wages fell 0.3% (+0.2% y/y) for
the second consecutive monthly decline. On a three-month growth basis,
wages fell at a 1.3% annual rate after 2.0% growth last year. Wages
& salaries in the private service-providing industries ticked
up 0.1% (3.6% y/y) and, here again, the trend growth of 3.0% is well
below a 2006 gain of 6.4%. Wages in the government sector rose 0.4%
(5.1% y/y) and three-month growth of 5.1% was stable.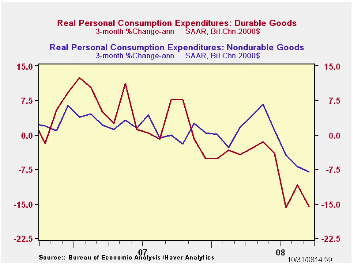
Proprietors' income fell 0.3% (+1.8% y/y) after a 1.0% August decline. On a three-month basis, the 3.4% rate of negative growth very much reflects the weaker retail environment, after the 4.1% gain last year. Interest income rose 1.1% (-0.2% y/y) for the third straight month due to the recent rise in interest rates off their March lows. Dividend income fell 0.6% (+4.1% y/y) for the third consecutive month and prior months' gains were revised away. Growth of 4.1% y/y compares to a 12.4% rise last year and a 21.7% rise during 2006.
Personal consumption expenditures fell 0.3% after the
unrevised sideways movement in August. Adjusted for price inflation, real
spending fell 0.4% (-0.4% y/y) last month for the third
decline in the last four months. Three-month growth in real spending
dropped to negative 3.9% (AR) after the 2.8% gain last year. Real
spending on motor vehicles fell at a 23.5% annual rate during the last
three months while furniture spending fell at a 10.9% rate following an
8.0% gain last year. Spending on clothing fell at a 14.6% rate during
the last three months after a 4.7% rise last year.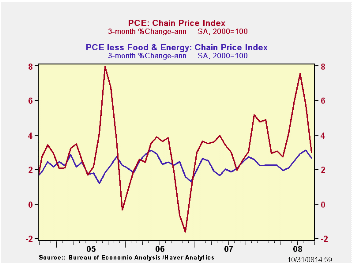
The PCE chain price index rose just 0.1% as a 0.7% decline (+31.5% y/y) in gasoline prices was offset by a 0.7% rise in food prices. On a three-month basis, food prices were up at a 9.1% rate after a 3.8% rise last year. The core PCE price index rose 0.2% for the second consecutive month but the rise surpassed Consensus expectations for a 0.1% uptick. Three-month growth of 2.6% was up from a 2.2% during all of last year. Apparel prices have been rising at a 6.6% rate after a 0.8% decline last year and transportation costs have been rising at a 5.2% rate after 2.7% growth last year.
The personal savings rate recovered to 1.3% as spending fell.
The figures noted above are available in the Haver USECON and in the USNA databases.
| Disposition of Personal Income (%) | September | August | Y/Y | 2007 | 2006 | 2005 |
|---|---|---|---|---|---|---|
| Personal Income | 0.2 | 0.4 | 3.9 | 6.1 | 7.1 | 5.6 |
| Disposable Personal Income | 0.2 | -1.0 | 4.2 | 5.5 | 6.4 | 4.4 |
| Personal Consumption | -0.3 | 0.0 | 3.8 | 5.5 | 5.9 | 6.2 |
| Saving Rate | 1.3 | 0.8 | 0.6 (Sept. '07) | 0.5 | 0.7 | 0.3 |
| PCE Chain Price Index | 0.1 | 0.0 | 4.2 | 2.6 | 2.8 | 2.9 |
| Less food & energy | 0.2 | 0.2 | 2.4 | 2.2 | 2.3 | 2.1 |
by Tom Moeller October 31 2008
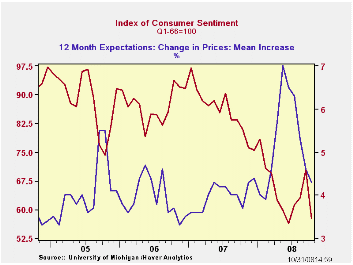
The University of Michigan's October reading of consumer sentiment collapsed by 18.1% from the September level, to 57.6. That was very much the same as reported at mid-month and the latest level was the lowest for the series since June which in turn was the lowest since early-1980. The drop was a record m/m decline for the index which dates back to the late 1970s. The full-month figure matched Consensus expectations.
During the last ten years there has been a 55% correlation
between the level of sentiment and the three-month change in real
consumer spending.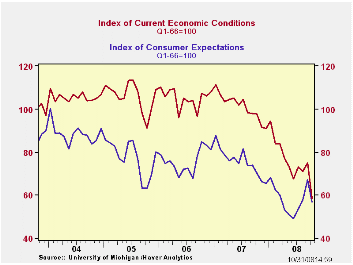
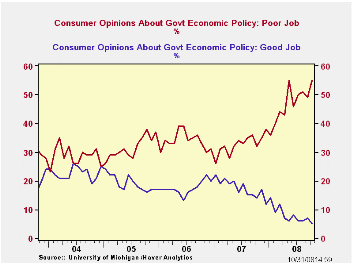
The opinion of government policy, which apparently influences economic expectations, fell sharply from September (-39.0% y/y) but it was slightly better than the mid-month read. Only five percent of respondents thought that a good job was being done by government while 55% thought a poor job was being done. That was the highest percentage on record.
As reported at mid-month, the current conditions index led the collapse with 22.1% decline. The view of current personal finances gave back all of a September improvement with a m/m decline of one-third. The index of buying conditions for large household goods fell 16.8% m/m to the lowest level since 1980, down 37.3% y/y.
The expectations component of consumer sentiment aided the m/m
decline in the total with a 15.6% drop. Expectations for business
conditions during the next years collapsed by 24.6%, as reported at
mid-month. Expectations for conditions during the next five years fell
14.5% but they remained well up from their historic lows.The expected
change in personal finances fell 11.7%.
The mean expected rate of inflation during the next year slipped to 4.3% with lower oil prices, down from the mid-month expectation. It was as high as 7.0% in May but the expectation was still above prior years. The expected inflation rate during the next five years fell to 3.1%, the lowest level since 2003.
The University of Michigan survey is not seasonally adjusted.The reading is based on telephone interviews with about 500 households at month-end; the mid-month results are based on about 300 interviews. The summary indexes are in Haver's USECON database, with details in the proprietary UMSCA database.
What Is Liquidity Risk? from the Federal Reserve Bank of San Francisco and it can be found here.
Monetary Policy Transparency and Private Sector Forecasts: Evidence from Survey Data from the Federal Reserve Bank of Kansa City is available here.
| University of Michigan | October | Mid-October | September | October y/y | 2007 | 2006 | 2005 |
|---|---|---|---|---|---|---|---|
| Consumer Sentiment | 57.6 | 57.5 | 70.3 | -28.8% | 85.6 | 87.3 | 88.5 |
| Current Conditions | 58.4 | 58.9 | 75.0 | -40.2 | 101.2 | 105.1 | 105.9 |
| Expectations | 57.0 | 56.7 | 67.2 | -18.7 | 75.6 | 75.9 | 77.4 |
by Tom Moeller October 31, 2008
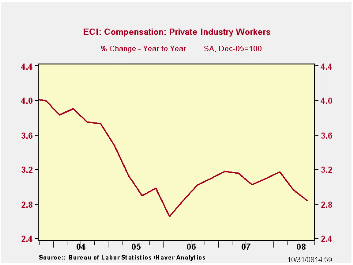
The employment cost index for private industry workers increased by 0.6% last quarter. It was stable with 2Q and that was the weakest rate of gain since 1Q 2006. It also fell short of Consensus expectations for a 0.7% rise. The rise held roughly steady with the 3.0% y/y growth in compensation during the last three years.
During the last twenty years there has been a 54% correlation between the growth in employee compensation and the rise in the PCE price index. That level of correlation goes neither up or down, when either series is led or lagged the other. This suggests a self reinforcing effect between the two series.
Wage and salary growth again dipped slightly, last quarter to
0.6% versus 0.7% to 0.8% increases during the prior four quarters.
Wages account for roughly 70% of the compensation index. Wages in the
services industries grew 0.6% and the y/y gain of 2.8% was the slowest
since 2006, down from 4.6% growth back in 2000. Wages in the goods
producing industries rose 0.4% (2.7% y/y) and that y/y growth compares
to a recent peak of 4.5% in 2004.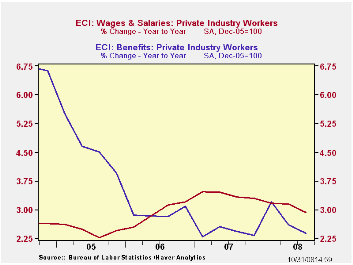
The rise in benefit costs picked up slightly to 0.6% but the 2.4% year-to-year rise was near the slowest since 1999. In the goods producing sector benefits ticked up 0.1% (2.2% y/y) and in services they rose 0.6% (2.5% y/y), the same as during the prior two quarters.
Health benefit costs rose 3.9% y/y and that was the slowest rate of growth since 1999.
| ECI - Private Industry Workers (%) | 3Q '08 | 2Q '08 | 1Q '08 | 3Q Y/Y | 2007 | 2006 | 2005 |
|---|---|---|---|---|---|---|---|
| Compensation | 0.6 | 0.6 | 0.8 | 2.8 | 3.1 | 2.9 | 3.1 |
| Wages & Salaries | 0.6 | 0.7 | 0.8 | 2.9 | 3.4 | 2.9 | 2.5 |
| Benefit Costs | 0.6 | 0.5 | 0.6 | 2.4 | 2.4 | 2.9 | 4.6 |
by Robert Brusca October 31 2008
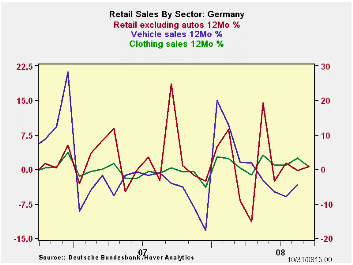
The German consumer has kept a stiff upper lip according to the November reading on the consumer from GfK. Still the consumer has been stiffening more than just his and her lip. The old wallet seems to have become a bit less pliable as Germans have tightened up on spending. Retail sales plunged in September, dropping by 2.5% and obliterating the 2.4% pop in August. The drop will still leave NOMINAL German retail sales advancing in Q3 but real ex auto German sales are shrinking in Q3 at a 0.5% annual rate.
The sequential growth rates on German nominal retail spending are very flat. The real retail sales ex auto sequential growth rates are similarly steady but at shallow negative rates of growth.
The good news for Germany is that the September drop in retail sales can be called a plunge but it only offsets the spike in August. There is nothing in the data or trends that suggest things are about to get much worse. But that does not mean that they won’t either.
| German Real and Nominal Retail Sales | QTR | |||||||
|---|---|---|---|---|---|---|---|---|
| Nominal | Sep-08 | Aug-08 | Jul-08 | 3-MO | 6-MO | 12-MO | YrAgo | Saar |
| Retail Ex auto | -2.5% | 2.4% | 0.2% | 0.0% | 0.8% | 0.8% | 0.4% | 2.2% |
| Food, Bev & Tobacco | -1.6% | 3.1% | -0.2% | 5.0% | 0.4% | 0.9% | 0.0% | 2.6% |
| Clothing footwear | 8.7% | -1.2% | 4.1% | 56.7% | 30.0% | 0.6% | 18.5% | 10.8% |
| Real | ||||||||
| Retail Ex auto | -2.3% | 1.9% | -0.1% | -2.0% | -1.4% | -2.1% | -0.6% | -0.5% |

Tom Moeller
AuthorMore in Author Profile »Prior to joining Haver Analytics in 2000, Mr. Moeller worked as the Economist at Chancellor Capital Management from 1985 to 1999. There, he developed comprehensive economic forecasts and interpreted economic data for equity and fixed income portfolio managers. Also at Chancellor, Mr. Moeller worked as an equity analyst and was responsible for researching and rating companies in the economically sensitive automobile and housing industries for investment in Chancellor’s equity portfolio. Prior to joining Chancellor, Mr. Moeller was an Economist at Citibank from 1979 to 1984. He also analyzed pricing behavior in the metals industry for the Council on Wage and Price Stability in Washington, D.C. In 1999, Mr. Moeller received the award for most accurate forecast from the Forecasters' Club of New York. From 1990 to 1992 he was President of the New York Association for Business Economists. Mr. Moeller earned an M.B.A. in Finance from Fordham University, where he graduated in 1987. He holds a Bachelor of Arts in Economics from George Washington University.
More Economy in Brief


