 Global| May 14 2010
U.S. Retail Spending Remains Firm;Core Sales Are Strongest Since 2006
by:Tom Moeller
|in:Economy in Brief
Summary
Improvement in the job market definitely has translated into more business for U.S. retailers. Retail sales rose 0.4% last month. The gain was twice the Consensus expectation and the March increase was revised up to 2.1% from 1.6% [...]
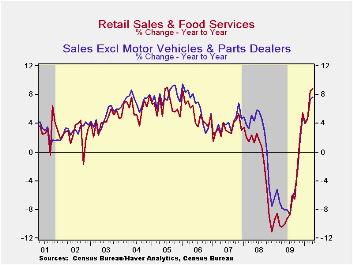
Improvement in the job market definitely has translated into more business for U.S. retailers. Retail sales rose 0.4% last month. The gain was twice the Consensus expectation and the March increase was revised up to 2.1% from 1.6% initially reported.Year-to-year, the 8.8% increase in sales was the strongest since 2005 although sales remained 3.6% below the pre-recession peak.
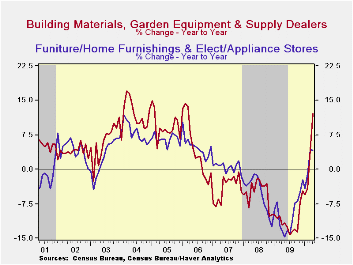
Nonauto sales also posted an expected 0.4% increase in April following two months of 1.2% gains. The March rise was double the advance indication. Bloating this increase was a 6.9% surge (12.1% y/y) in sales of building materials & garden equipment.
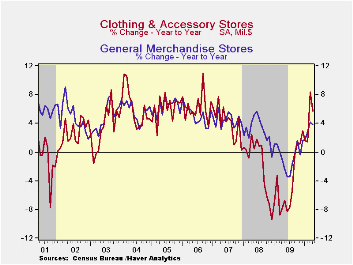
To the downside in April was "core" discretionary spending, though earlier gains are still improved. Apparel store sales fell 1.0% (+5.7% y/y), although they rose at a 15.3% rate during the last three months. Sales at furniture, home furnishings & electronics stores also fell by 0.8%, but the three-month change actually rose by 9.3% after two years of decline. Furniture sales alone declined 1.2% following two months of 2.0%+ increases. Sales of electronics & appliances fell for the second consecutive month. However, as a result of a strong beginning to the year, three-month sales increased at a 5.5% annual rate. Finally, sales at general merchandise stores slipped 0.4% (+3.9% y/y) but they rose at a 5.7% rate during the last three months.
Despite the decline in unit sales, motor vehicle sales rose 0.5% last month and at a 19.5% rate during the last three. Finally, sales at gasoline service stations rose just 0.5% (30.1% y/y) despite a 2.8% rise (39.0% y/y) in April gas prices. Are higher prices discouraging usage?
Earlier strength in internet & catalogue sales continued to abate. Sales ticked up just 0.2% and the three-month annualized rate of gain backed off further to 3.0% down from 25.3% growth in January.
| April | March | February | April y/y | 2009 | 2008 | 2007 | |
|---|---|---|---|---|---|---|---|
| Total Retail Sales & Food Services (%) | 0.4 | 2.1 | 0.6 | 8.8 | -6.0 | -0.8 | 3.3 |
| Excluding Autos | 0.4 | 1.2 | 1.2 | 7.6 | -4.8 | 2.4 | 3.9 |
| Non-Auto Less Gasoline | 0.4 | 1.3 | 1.3 | 5.1 | -1.9 | 1.6 | 3.6 |
by Tom Moeller May 14,2010
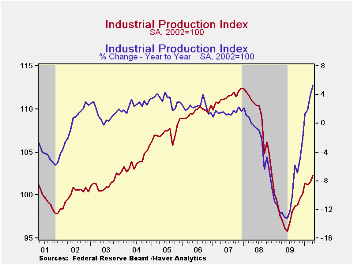
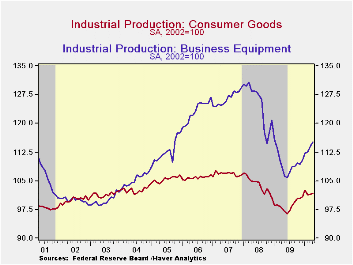
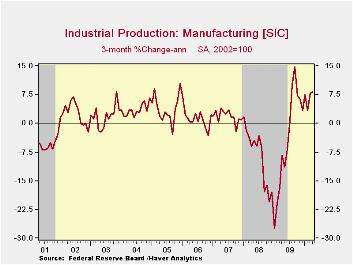
The industrial sector continued its improvement last month. Overall production rose 0.8% after a 0.3% March increase. It's up at a 6.4% annual rate so far this year. Though these gains are improved, they understate the degree of improvement following last year's recession. In the factory sector alone output rose 1.0% during the last two months and it has risen at a 9.1% rate so far this year.
Though gains in output this year have been broad-based, the rise in output of construction supplies and business equipment have been notable. Output of construction supplies has risen at a 20.1% (AR) in 2010 after last year's 17.8% decline. Nevertheless, output remained off 24% from the 2006 peak. Business equipment likewise has been strong with a 12.7% gain so far this year after the 12.4% 2009 drop. Output remained off 12% from the 2008 peak.
Elsewhere, output of consumer goods has posted a lesser gain of 1.8% so far this year held back by 4.1% rise in output of auto products and a 1.1% gain in output of computers, video and equipment. Output of appliances and furniture rose at a stronger 19.6% rate but here again the production level remains depressed and off one-third from the 2006 peak. Apparel output also posted a strong 20.2% gain this year after a 12.4% decline during 2009. Nevertheless, it's off two-thirds from 1994 as production has moved out of the States.
Capacity utilization rose further to 73.7%, its highest level since November 2008. In the factory sector alone utilization rose to 70.8% from the 2009 low of 65.1%.
The industrial production data are available in Haver's USECON database.
| Industrial Production (SA,%) | April | March | February | y/y | 2009 | 2008 | 2007 |
|---|---|---|---|---|---|---|---|
| Total Output | 0.8 | 0.3 | -0.2 | 5.2 | -9.7 | -2.2 | 1.5 |
| Manufacturing | 1.0 | 1.0 | 0.0 | 6.0 | -11.3 | -3.2 | 1.4 |
| Consumer Goods | 0.2 | 0.1 | -1.3 | 3.8 | -5.2 | -2.6 | 0.9 |
| Business Equipment | 1.1 | 1.2 | 0.3 | 6.1 | -12.4 | -1.1 | 2.7 |
| Construction Supplies | 2.7 | 2.8 | -0.6 | 2.8 | -17.8 | -6.3 | -2.0 |
| Materials | 1.0 | 0.0 | 0.7 | 7.0 | -10.9 | -1.9 | 2.0 |
| Utilities | -1.3 | -6.0 | -1.7 | -2.5 | -2.5 | 0.3 | 3.4 |
| Capacity Utilization (%) | 73.7 | 73.1 | 73.8 | 69.2 (April '09) | 70.1 | 77.5 | 80.6 |
| Factory Utilization | 70.8 | 70.0 | 69.2 | 65.8 | 66.8 | 75.1 | 79.0 |
by Tom Moeller May 14,2010
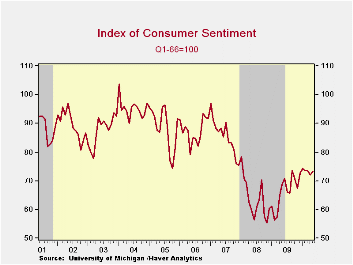
The University of Michigan reported that its mid-May reading of consumer sentiment rose slightly to 73.3 from 72.2 during all of April. The figure roughly reversed the modest April decline and was as expected. Despite this unimpressive performance, the reading was up by one-third from its 2008 low.
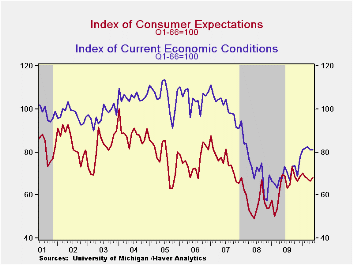
The index of expected economic conditions improved m/m to 68.3. Here again, the figure has moved sideways of late but is 38.8% above the 2008 low. The readings for expected change in personal finances (-4.4% y/y), business conditions during the next twelve months (12.0% y/y) and expected five-year business conditions (-9.1% y/y) each recently have been flat-to-lower.
Sentiment about current economic conditions moved sideways. It remained up 19.8% from last year and up 41.1% from the 2008 low. The assessment of current personal finances nudged higher m/m (31.1% y/y) but buying conditions for large household goods, including furniture, refrigerators, stoves & televisions fell (+14.2% y/y).
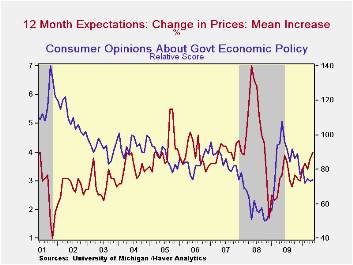
Expected price inflation during the next year increased to 4.0% and was up from the December 2008 reading of 1.7%.Respondents' view of government policy, which may eventually influence economic expectations, was stable m/m but down roughly one-third from its high last May. Twelve percent of respondents thought that a good job was being done by government versus 38% who thought a poor job was being done, near the twelve-month high.
| University of Michigan | Mid-May | April | March | May y/y | 2009 | 2008 | 2007 |
|---|---|---|---|---|---|---|---|
| Consumer Sentiment | 73.3 | 72.2 | 73.6 | 6.7% | 66.3 | 63.8 | 85.6 |
| Current Conditions | 81.1 | 81.0 | 82.4 | 19.8 | 69.6 | 73.7 | 101.2 |
| Expectations | 68.3 | 66.5 | 67.9 | -1.6 | 64.1 | 57.3 | 75.6 |

Tom Moeller
AuthorMore in Author Profile »Prior to joining Haver Analytics in 2000, Mr. Moeller worked as the Economist at Chancellor Capital Management from 1985 to 1999. There, he developed comprehensive economic forecasts and interpreted economic data for equity and fixed income portfolio managers. Also at Chancellor, Mr. Moeller worked as an equity analyst and was responsible for researching and rating companies in the economically sensitive automobile and housing industries for investment in Chancellor’s equity portfolio. Prior to joining Chancellor, Mr. Moeller was an Economist at Citibank from 1979 to 1984. He also analyzed pricing behavior in the metals industry for the Council on Wage and Price Stability in Washington, D.C. In 1999, Mr. Moeller received the award for most accurate forecast from the Forecasters' Club of New York. From 1990 to 1992 he was President of the New York Association for Business Economists. Mr. Moeller earned an M.B.A. in Finance from Fordham University, where he graduated in 1987. He holds a Bachelor of Arts in Economics from George Washington University.
More Economy in Brief


