 Global| May 11 2007
U.S. Retail Sales: Weak in April but Stronger in March
Summary
Result: Surprising - good growth in Q2. Retail sales fell by 0.2% in April the first month of the second quarter yet sales in Q2 are up nicely so far. How can that be? The reason is that for GDP we look at what happens in quarter on [...]
Result: Surprising - good growth in Q2.
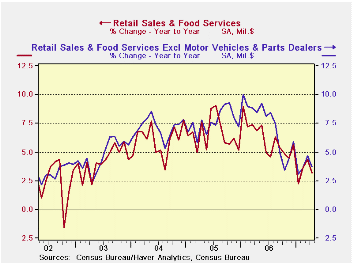
Retail sales fell by 0.2% in April the first month of the second quarter… yet sales in Q2 are up nicely so far. How can that be? The reason is that for GDP we look at what happens in quarter on average. And in Q1 sales got stronger as the quarter went on. So, in March, the month of the quarter sales were well above the Q1 average. The small drop in sales in April therefore leaves sales growing in Q2. The growth rate for nominal sales in the quarter so far is 3.7% for overall sales. Taking out vehicle sales raises that to 5.5%. With vehicle and gasoline station sales removed the rise is 2.7%. While the 2.7% figure seems weak with gas station sales out of the total, most of the energy is removed so that comes much closer to being a real sales figure.On balance Q2 is off to a reasonably good start. The early Easter packed sales into March by sucking them out of April. But on balance we are still in good shape in Q2. Trends are moderately lower, but only moderately (see graph).
Clothing sales were weak in the month and are weak over the past three months with a three-month growth rate of -6.1% annualized. General merchandise is weak in that same way. But nondurables excluding gasoline sales are up at a 5.5% pace over three months and remain at a very steady pace (see table below). Durables spending was weak in the quarter on weakness in vehicle sales (-1%) and weakness in building materials (-2.3%) while furniture and electronics sales were up (1%) over three months. Durables sales are dropping, but only at a -0.6% annual rate. Year/year durables sales are flat due to the on-again off-again nature of vehicle sales and ongoing weakness in building materials. The weakness in building materials shows no sign of letting up.
| Retailing: | Mo/Mo | Seasonally Adjusted Annual Rate | |||
| Totals | Apr 2007 | 3-Mo | 6-Mo | Yr/Yr | Year Ago: Y/Y |
| Retail & Food Service | -0.2% | 5.3% | 5.6% | 3.2% | 6.8% |
| Retail Excl Motor Vehicles & Parts | 0.0% | 6.6% | 7.0% | 3.7% | 8.4% |
| Retail Excl Motor Vehicles & Parts & Gasoline |
-0.2% | 3.9% | 4.3% | 4.0% | 7.4% |
| Retailing: | Mo/Mo | Seasonally Adjusted Annual Rate | |||
| Durables | Apr 2007 | 3-Mo | 6-Mo | Yr/Yr | Year Ago: Y/Y |
| Total Durables | -1.0% | -0.6% | 0.9% | 0.0% | 5.0% |
| Building Materials | -2.3% | -7.7% | -2.9% | -6.0% | 14.0% |
| Motor Vehicles & Parts | -1.0% | 0.8% | 0.7% | 1.3% | 1.2% |
| Motor Vehicles Dealers | -0.9% | 0.8% | 1.0% | 1.4% | 1.0% |
| Furniture, Electronics | 1.0% | 5.0% | 7.6% | 4.9% | 7.8% |
| Retail | Mo/Mo | Seasonally Adjusted Annual Rate | |||
| Nondurables | Apr 2007 | 3-Mo | 6-Mo | Yr/Yr | Year Ago: Y/Y |
| Total Nondurables | 0.2% | 8.5% | 8.2% | 4.8% | 7.8% |
| Food & Beverages | 0.5% | 8.2% | 5.1% | 6.6% | 4.0% |
| Health | 0.9% | 8.7% | 5.7% | 8.1% | 6.0% |
| Gasoline | 1.7% | 29.2% | 30.0% | 1.5% | 16.3% |
| Clothing | -2.0% | -6.1% | 3.2% | 4.7% | 5.2% |
| Sport Goods | -0.8% | 9.5% | 4.0% | 0.1% | 6.9% |
| General Merchandise | -1.2% | -1.3% | 4.3% | 3.1% | 6.2% |
| Non-Store Retailers | 1.8% | 22.5% | 10.7% | 9.3% | 10.9% |
| Miscellaneous Retail | 0.4% | 8.7% | 5.7% | 8.1% | 6.0% |
| Nondurables Excl Gasoline | -0.1% | 5.5% | 5.1% | 5.4% | 6.5% |
| Services | |||||
| Food Service & Drinking | -0.1% | 2.0% | 3.7% | 4.9% | 7.4% |
by Robert Brusca May 11, 2007
The inventory picture has cleared a bit in recent months. We can now see that we in the grip on an inventory liquidation cycle. But how firmly are we in this ‘grip?’ How much will it squeeze? And for how long?
This month inventories fell. Since Jan of 2000 inventories have dropped in a month only 26 times; that’s about 30% of the time. But the bulk of those declines came in recession or leading up to it. Fully 13 of them came in the 15-months from January of 2000 when inventories fell 13 times as sales fell m/m in eight of those months. In 2003 things slowed again and from Dec of 2002 sales dropped five times through August as inventories fell in seven distinct months. So inventory drops are not isolated events but rather they are a response to weak sales. AND to say this is to say that firms take a concentrated effort to pare inventories on those occasions since weak or falling sales if not responded to will make inventories grow, not shrink, unless the slowing was fully anticipated.
Outside of these strings of weakness inventory drops occur only about 10% of the time. Not all sales and inventory declines are bunched together. In March as overall inventories fell by 0.1%, sales were rising at a strong 1.4%. However, sales have seen some weakness lately as they did fall by 0.9% last in January 2007, and in Sept and Oct of 2006 before that. Sales clearly have weakened and Yr/Yr business sales are now running at a 3.7% pace up from a low of 1.6% in January but well below the growth of 7% to 8% that persisted from March 2004 until about August of last year.
So one question we are looking to address is whether this is one of those improbable 10% drops in inventories or whether it is something else. It looks to be ‘something else’ (unfortunately) but that ‘something else’ does not appear to be very severe.
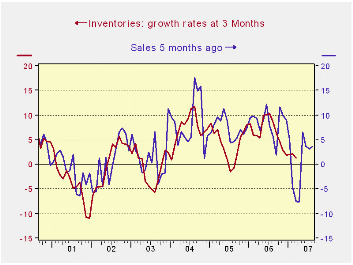
The chart above shows the time series growth relationship between inventories and sales growth rates at 3-Mos. Sales growth rates are led by five months. On this basis a very regular pattern emerges between sales and inventories. This framework suggests that sales slowdowns are unanticipated and take about five months for firms to recognize them and take action. We are currently in our weakest sales period since late 2003. If we look at the next five months of sales (plotted ahead here due to the lag), 3-mo growth is set to rise from -7.4% to +6.6% and settle in at +3.3%. That should be enough to restore inventory growth to positive. We can see that what is in progress here is the inventory cycle. While the recent sales downdraft was sharp, the period of negative growth rates was brief and sales are growing again. We have every reason to believe that this inventory correction will be mild and short.
The table above puts inventory to sales trends in perspective. It shows that MFG is the only sector with lingering I:S problems. That is to say, in MFG, sales growth is still weaker than Inventory growth; indeed sales, over the past three months are still declining. Not surprisingly I:S ratios in MFG are in the top 80% of their three Yr range (far right of table). But retail stocks are lean, residing in the bottom 10% of their three year I:S ratios. Wholesale stocks are mildly low relative to sales in the bottom one-third of their 3-Yr range.
As a result we see the inventory cycle as having a few months to run yet. Whether it is done depends on sales continuing to grow, however. Sales growth rates have built steadily for retail sector and are back at 7% over 3-Months for retailers. Wholesalers have been steady at 7% to 8% over three months, six months and a year. Manufacturers are the problem. Their sales have slumped and flattened and are still declining. But inventories are still growing raising the prospect of adjustment yet to come to this sector. And, of course most of our monthly economic readings come from this troubled sector not from the more healthy ones.
| 2007 Mar | 2007 Feb | 2006 Dec | ||||
| Sales | Inventory | Sales | Inventory | Sales | Inventory | |
| Total Business | 3.5% | 1.3% | 3.1% | 2.1% | 3.7% | 2.0% |
| Manufacturers | -2.9% | 0.9% | -3.7% | 1.0% | -0.6% | 1.7% |
| Retailers | 7.2% | -1.5% | 7.3% | 2.3% | 6.0% | 0.2% |
| Wholesalers | 7.7% | 5.3% | 7.2% | 3.0% | 6.7% | 4.9% |
by Robert Brusca May 11, 2007
Wolf of a headline but lamb inside...
Of course the PPI headline is scary. But we know that it is energy with an assist from food. But if you look at the core you will see that not only this month but in general it has been pretty stable. We still think that inflation problems lurk but we do not think energy is the source of worry.
When headline inflation swung it did tend to transmit some of those changes to the core, as the graph above shows. But the transmission effects were very muted. Headline inflation bottomed at -2.8% in January 2002 while core inflation bottomed at -0.6% in December of that same year. Headline inflation swept higher to peak at 6.8% in Sept 2005 while core inflation peaked at 2.9% and did so in July ahead of the headline. With headline inflation swinging in a range of 9.6 percentage points core inflation swung in a range of 3.5 percentage points. And those statistics refer to the most extreme monthly observations. We are still seeing some ‘wild’ swings in headline inflation but they are not as long-lasting as in 2001. Thus the impact will be blunted. Core inflation is in fact falling over the past six months when the headline has been rising. We are more worried about the transmission to core inflation from labor costs since headline inflation looks much more like it is unstable month to month than it looks to be trending higher. 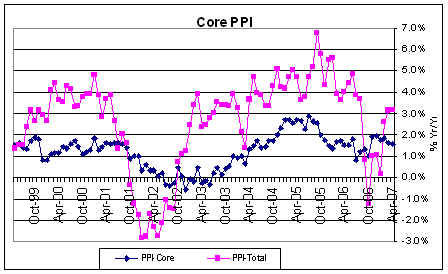
Moreover, this next push up in energy prices will be small compared to the previous one.
The table shows that inflation trends of all sorts are still fairly well contained. However since goods inflation has been lower than service sector inflation we need for goods inflation to be well be the 2% mark for it to be compatible with the Fed’s 2% (or 2.4% in CPI terms) ‘core’ maximum in terms of its unofficial comfort zone – I know it sounds like something from a foot doctor.
It is striking how inflation has built over the past three months in energy and foods but how when you remove the food and energy from PPI measures inflation rates calm down immediately. Finished consumer goods inflation, the part of this report that feeds into the CPI fell by 0.1% this month. For the CPI however we have to add in the markups to take producer goods to retail, then add services and add in imports to get to the CPI itself. There is no assurance on this but since service sector wages have been decompressing and import prices for consumer goods and vehicles have been moderate, looking for a moderate CPI core is a reasonable thing to do even in the face of surging energy and rising food prices.
| Apr-07 | PPI Trends By Type Of Good | ||||
| PPI | 1Mo:M/M | 3-Mo:ar | 6-Mo:ar | 1-Yr | Yr-Ago |
| Total PPI | 0.7% | 12.8% | 10.0% | 3.2% | 4.0% |
| Finished Consumer Goods | 0.9% | 16.6% | 12.2% | 3.5% | 4.9% |
| Consumer Foods | 0.4% | 15.4% | 12.7% | 7.8% | -0.9% |
| Finished Consumer Goods Excl Foods | 1.1% | 16.8% | 11.9% | 2.1% | 7.1% |
| Nondurables less Food | 1.7% | 25.2% | 15.7% | 2.8% | 9.9% |
| Consumer Nondurable excl Food and Energy | -0.1% | 3.8% | 3.1% | 2.2% | 2.7% |
| Durable Goods | -0.2% | -1.2% | 3.1% | 0.4% | 0.1% |
| Finished Core Consumer Goods | -0.1% | 1.7% | 3.2% | 1.4% | 1.6% |
| Capital Goods | 0.1% | 1.4% | 3.2% | 1.8% | 1.5% |
| Manufacturing Industries | 0.2% | 2.1% | 3.0% | 2.8% | 1.8% |
| Nonmanufacturing Industries | 0.1% | 0.8% | 3.3% | 1.5% | 1.3% |
| Core PPI | 0.0% | 1.5% | 3.2% | 1.6% | 1.5% |
| Memo: Finished Energy | 3.4% | 50.6% | 30.2% | 3.5% | 17.7% |
by Carol Stone May 11, 2007
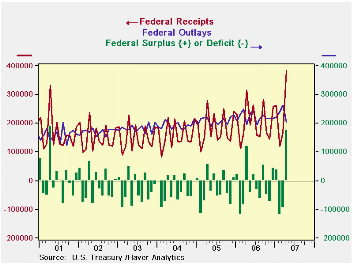
We know this is [literally] yesterday's news, but the state of the US Government budget for April 2007 deserves comment regardless. The Treasury took in a record $383.6 billion in the month, contributing to a surplus of $177.7 billion, the second largest monthly surplus ever. This result well exceeded the year-ago figure of $118.8 billion and was considerably larger than consensus forecasts of $140 billion. The associated outlay total was $206.0 billion. The largest surplus was in April 2001, $189.8 billion, when the receipts rolled in from the peak of the tech boom.
For the fiscal year to date (since October), the deficit has been $80.8 billion, compared with $184.8 billion in the same period a year ago. Receipts are up 11.2%, while outlays have increased only 3.2%.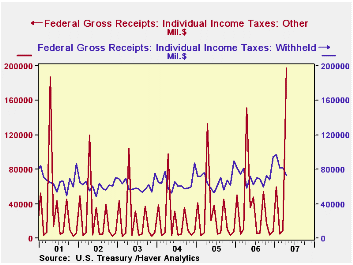
Individual income taxes in April were a monthly record $226.3 billion, up 33.9% from a year ago. This increase consisted in a hefty jump in individual income taxes, with withholdings up 24.4%; this does, however, follow a restrained withholding figure for March. Year-to-date withholdings are up 10.7%. "Other" individual tax payments, those submitted with 2006 tax returns, came in at an eye-popping $197.8 billion, almost 31% ahead of last year. These taxes, which cover non-wage income, were $300.5 billion for the fiscal year to date, up almost 26% from the comparable year-ago period. Corporate income taxes were $46.7 billion in April, up 6.1% from April 2006; the year-to-date gain has been 15.2%, as December and March quarterly payments were both up from year-ago amounts by a substantial margin. Social insurance taxes were $95.9 billion in April, up 9.3% from April 2006 and 6.2% for the year-to-date.
As noted above, outlays were $206.0 billion, up 5.0% from a year ago. The fiscal year total so far is up just 3.2%. Defense outlays were $41.2 billion, up 3.5% from last April, with the cumulative amount for the fiscal year so far up 6.0% from the year earlier. Social security outlays were $48.8 billion in April, up 5.5%. Interest expense continues to climb, rising 21.6% in April from the year ago, and up 5.2% for the year so far. Last month here, we suggested that calendar quirks had advanced spending in several government programs forward to March and that they could slow commensurately in April. This appears to have occurred. Overall, total spending is expanding quite modestly, making it easier to keep the federal budget position under control for fiscal 2007 as a whole, even if tax receipt growth were to slow in the remaining months.
| US Government Budget, Bil.$ | Apr 2007 | Mar 2007 | Oct 2006- Apr 2007 |
Oct 2005- Apr 2006 |
FY 2006 | FY 2005 | FY 2004 |
|---|---|---|---|---|---|---|---|
| Budget Balance | +177.7 | -96.3 | -80.8 | -184.1 | -248.2 | -318.7 | -411.1 |
| Net Revenues | 383.6 | 166.5 | 1504.6 | 1352.7 | 2,406.7 | 2,153.4 | 1,879.8 |
| 11.2% | 11.2% | 11.8% | 14.6% | 5.4% | |||
| Net Outlays | 206.0 | 262.8 | 1585.3 | 1536.8 | 2,654.9 | 2,472.1 | 2,290.9 |
| 3.2% | 5.8% | 7.4% | 7.9% | 6.2% |

Robert Brusca
AuthorMore in Author Profile »Robert A. Brusca is Chief Economist of Fact and Opinion Economics, a consulting firm he founded in Manhattan. He has been an economist on Wall Street for over 25 years. He has visited central banking and large institutional clients in over 30 countries in his career as an economist. Mr. Brusca was a Divisional Research Chief at the Federal Reserve Bank of NY (Chief of the International Financial markets Division), a Fed Watcher at Irving Trust and Chief Economist at Nikko Securities International. He is widely quoted and appears in various media. Mr. Brusca holds an MA and Ph.D. in economics from Michigan State University and a BA in Economics from the University of Michigan. His research pursues his strong interests in non aligned policy economics as well as international economics. FAO Economics’ research targets investors to assist them in making better investment decisions in stocks, bonds and in a variety of international assets. The company does not manage money and has no conflicts in giving economic advice.
More Economy in Brief


