 Global| Nov 16 2009
U.S. Retail Sales Rise As CoreSales Improve Again
by:Tom Moeller
|in:Economy in Brief
Summary
Consumers seem to be gaining back the inclination to spend. Retail sales last month rose 1.4% after a 2.3% September decline that was deeper than reported initially. A 0.9% October gain was the Consensus expectation. The increase [...]
 Consumers
seem to be gaining back the inclination to spend. Retail sales last
month rose 1.4% after a 2.3% September decline that was deeper than
reported initially. A 0.9% October gain was the Consensus expectation.
The increase improved the y/y change in sales to -1.7% from declines of
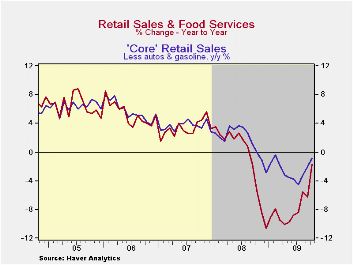
roughly 10% earlier this year. Moreover, spending on "core" retail
sales has improved. Month-to-month changes in overall sales in recent
months have been quite volatile due to auto sales promotions and rising
gasoline prices. Aside from these distortions, gains in consumer
spending have been steady during the last three months and y/y growth
also improved. The retail sales data are available in Haver's USECON
database.
Consumers
seem to be gaining back the inclination to spend. Retail sales last
month rose 1.4% after a 2.3% September decline that was deeper than
reported initially. A 0.9% October gain was the Consensus expectation.
The increase improved the y/y change in sales to -1.7% from declines of
roughly 10% earlier this year. Moreover, spending on "core" retail
sales has improved. Month-to-month changes in overall sales in recent
months have been quite volatile due to auto sales promotions and rising
gasoline prices. Aside from these distortions, gains in consumer
spending have been steady during the last three months and y/y growth
also improved. The retail sales data are available in Haver's USECON
database.
 Auto sales of late have been
influenced by Detroit's sales
programs. Last month, retail sales of motor vehicles jumped 7.4% after
a 14.3% decline during September and a 10.2% August jump. Less autos,
sales rose 0.2% versus a 0.4% expected gain. Higher gasoline prices
also have influenced overall sales growth. Without autos &
gasoline, retail sales rose 0.3% last month, about as they did during
the prior two months. These gains raised the y/y change to
-0.8% from -4.4% as of July.
Auto sales of late have been
influenced by Detroit's sales
programs. Last month, retail sales of motor vehicles jumped 7.4% after
a 14.3% decline during September and a 10.2% August jump. Less autos,
sales rose 0.2% versus a 0.4% expected gain. Higher gasoline prices
also have influenced overall sales growth. Without autos &
gasoline, retail sales rose 0.3% last month, about as they did during
the prior two months. These gains raised the y/y change to
-0.8% from -4.4% as of July.
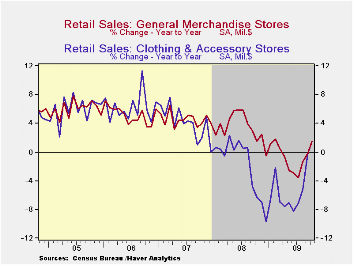
 In soft goods, the 0.4%
increase in apparel store sales was the fourth gain in as many months
and the y/y change of 1.5% was improved from -9.7% during December.
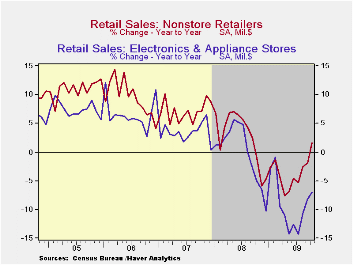
Finally, improvement in sales at furniture, electronics &
appliance store sales has been less impressive. Sales fell 0.7% last
month and the y/y change improved only to -7.3% from -14.3% at its
worst. Furniture store sales alone fell 0.8% (-7.6% y/y) after two
months of increase while sales of electronics & appliances
slipped 0.6% (-7.0% y/y), also after two months of increase.
Internet
and catalogue purchases were firmer and rose 1.0% (1.6% y/y). The gain
contrasted with a 7.6% y/y decline as of April. Finally, restaurant
sales jumped 1.2% (1.5% y/y) after little change either m/m or y/y as
of September. Finally, building materials sales continued their slump
and fell 2.4% (-15.0% y/y).
In soft goods, the 0.4%
increase in apparel store sales was the fourth gain in as many months
and the y/y change of 1.5% was improved from -9.7% during December.
Finally, improvement in sales at furniture, electronics &
appliance store sales has been less impressive. Sales fell 0.7% last
month and the y/y change improved only to -7.3% from -14.3% at its
worst. Furniture store sales alone fell 0.8% (-7.6% y/y) after two
months of increase while sales of electronics & appliances
slipped 0.6% (-7.0% y/y), also after two months of increase.
Internet
and catalogue purchases were firmer and rose 1.0% (1.6% y/y). The gain
contrasted with a 7.6% y/y decline as of April. Finally, restaurant
sales jumped 1.2% (1.5% y/y) after little change either m/m or y/y as
of September. Finally, building materials sales continued their slump
and fell 2.4% (-15.0% y/y).
| October | September | August | Y/Y | 2008 | 2007 | 2006 | |
|---|---|---|---|---|---|---|---|
| Retail Sales & Food Services (%) | 1.4 | -2.3 | 2.4 | -1.7 | -0.8 | 3.3 | 5.3 |
| Excluding Autos | 0.2 | 0.4 | 0.8 | -2.6 | 2.5 | 3.9 | 6.3 |
| Less Gasoline | 0.3 | 0.3 | 0.4 | -0.8 | 1.6 | 3.6 | 5.7 |
U.S. Business Inventory Decumulation Slows
by Tom Moeller November 16, 2009
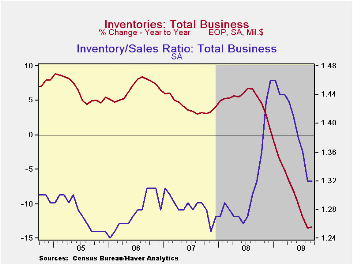
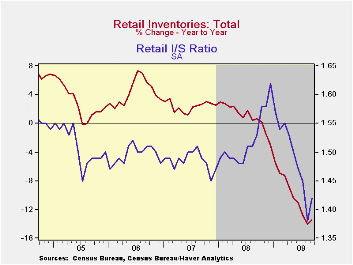
Perhaps the recent, moderate turnaround in final demand evident in the economy has begun to affect business' inclination to shed inventory. Or maybe there's nothing left on the lot, in the warehouse or on the shelf to let go. Either way, business inventories slipped just 0.4% during September which was one-third of the monthly decumulation averaged back to October of last year. The decline also fell short of Consensus expectations for a 0.7% drop.
The overall slowdown was caused by a 0.6% increase in retail inventories, the first gain since last July. That increase resulted from a 3.8% (-27.9% y/y) rise in auto inventories which also was the first since July of last year. In contrast, the monthly rate of decline in nonauto inventories continued at 0.6% (-7.5% y/y). Furniture inventories increased 0.1% (-12.5% y/y) but clothing inventories fell a sharp 1.7% (-10.8% y/y). General merchandise inventories fell 0.4% and were off 6.3% y/y while building materials stores slipped just 0.1% (-9.6% y/y). Factory inventories fell a hard 1.0%. Meanwhile, wholesale inventories were off 0.9% and the y/y decline reached a nadir of 15.0%. Excluding oil, wholesale inventories fell 0.9% and the 15.4% rate of decline also was a new low.
Despite a possible interest in slowing the rate of inventory cutbacks, the inventory-to-sales ratio for total business held at the cycle low of 1.32 versus a high of 1.46 in January. The latest was the lowest since last September. In the retail sector the ratio moved higher as a result of the auto inventory rise, but at 1.42 it still was the second lowest of the cycle. For manufacturers and wholesalers, the ratio fell to new cycle lows.
The business sales and inventory data are available in Haver's USECON database.
The Behavior of Household and Business Investment over the Business Cycle from the Federal Reserve Bank of Richmond can be found here.
| Business Inventories (%) | September | August | July | Y/Y | 2008 | 2007 | 2006 |
|---|---|---|---|---|---|---|---|
| Total | -0.4 | -1.6 | -1.1 | -13.4 | 0.6 | 4.0 | 6.4 |
| Retail | 0.6 | -2.6 | -1.0 | -13.9 | -3.1 | 2.5 | 3.3 |
| Retail excl. Auto | -0.6 | -0.7 | -0.5 | -7.5 | -1.8 | 2.7 | 4.7 |
| Wholesale | -0.9 | -1.3 | -1.6 | -15.0 | 3.1 | 6.2 | 8.2 |
| Manufacturing | -1.0 | -0.9 | -0.9 | -11.8 | 2.1 | 3.7 | 8.2 |
Empire State Factory Conditions Slip From October High
by Tom Moeller November 16, 2009
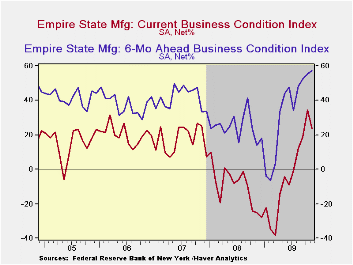 The
Federal Reserve Bank of New York reported that its November Empire
State Factory Index of General Business Conditions slipped to 23.51
during November. Nevertheless, that level still remained near the
highest level since 2004. The latest reading compares to sharply
negative levels this past winter and suggests positive growth in
factory sector activity. The latest level fell short of Consensus
expectations for a reading of 30.0.
The
Federal Reserve Bank of New York reported that its November Empire
State Factory Index of General Business Conditions slipped to 23.51
during November. Nevertheless, that level still remained near the
highest level since 2004. The latest reading compares to sharply
negative levels this past winter and suggests positive growth in
factory sector activity. The latest level fell short of Consensus
expectations for a reading of 30.0.
The figure is a diffusion index. Since the series' inception in 2001, there has been a 75% correlation between its level and the three-month change in U.S. factory sector industrial production. Like the Philadelphia Fed Index of General Business Conditions, the Empire State Business Conditions Index reflects answers to independent survey questions; it is not a weighted combination of the components. The series dates back only to 2001.
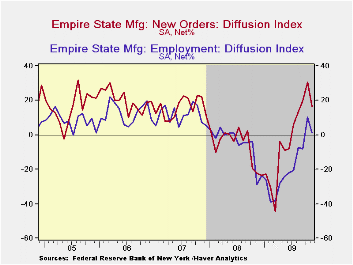 The
new orders component fell to 16.66 from its October high. The shipments
index also fell as did the employment index to a slim 1.32 from its
highest level since 2007. In the history of the NY employment index,
there has been an 87% correlation between the employment index and the
three-month growth in overall U.S. factory sector employment as
reported by the Labor Department. The workweek index also fell m/m but
remained significantly higher than the February low.
The
new orders component fell to 16.66 from its October high. The shipments
index also fell as did the employment index to a slim 1.32 from its
highest level since 2007. In the history of the NY employment index,
there has been an 87% correlation between the employment index and the
three-month growth in overall U.S. factory sector employment as
reported by the Labor Department. The workweek index also fell m/m but
remained significantly higher than the February low.
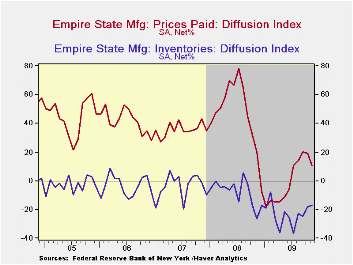
The prices paid index eased to its lowest level since July and remained down sharply from all of last year. Since inception in 2001, there has been a 77% correlation between the index of prices paid and the three-month change in the core intermediate materials PPI.
 The Empire
State index
of expected business conditions in six months rose during
November rose to its highest level since early-2004. The subseries for
new orders, employment, prices and capital expenditures each rose. The
inventory subseries rose sharply to it highest since early last year.
The Empire
State index
of expected business conditions in six months rose during
November rose to its highest level since early-2004. The subseries for
new orders, employment, prices and capital expenditures each rose. The
inventory subseries rose sharply to it highest since early last year.
The Empire State Manufacturing Survey is a monthly survey of manufacturers in New York State. Participants from across the state in a variety of industries respond to a questionnaire and report the change in indicators from the previous month. Respondents also state the likely direction of these same indicators six months ahead. For more on the Empire State Manufacturing Survey, including methodologies and the latest report, click here. The Empire State data is available in Haver's SURVEYS database.
Today's speech by Fed Chairman Ben S. Bernanke On the Outlook for the Economy and Policy can be found here here.
| Empire State Manufacturing Survey | November | October | November '08 | 2008 | 2007 | 2006 |
|---|---|---|---|---|---|---|
| General Business Conditions (diffusion index, %) | 23.51 | 34.57 | -24.93 | -10.10 | 17.23 | 20.24 |
| New Orders | 16.66 | 30.82 | -22.29 | -6.25 | 15.71 | 20.11 |
| Employment | 1.32 | 10.39 | -28.92 | -5.36 | 11.28 | 12.62 |
| Prices Paid | 10.53 | 19.48 | 20.48 | 46.99 | 35.64 | 41.88 |
Japanese GDP Growth In Q3 Surprises: Due To Increased Demand Or Inventory Building?
by Louise Curley November 16, 2009
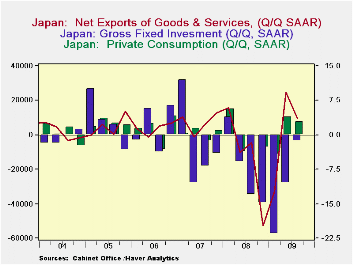 The Japanese
economy grew more than expected in the third quarter. The
annual rate of increase was 4.79% continuing the recovery that began in
the second quarter with an annual rate of increase of 2.72%.
The annual rates of change in private consumption and fixed investment
and the annual rate of difference in net exports are show in the first
chart. Japan still has a long way to go to recoup the losses from the
recent deep depression. The annual rate of real GDP in the
third quarter was 531.3 trillion yen, compared the 569.1 trillion yen
reached in the first quarter of 2008.
The Japanese
economy grew more than expected in the third quarter. The
annual rate of increase was 4.79% continuing the recovery that began in
the second quarter with an annual rate of increase of 2.72%.
The annual rates of change in private consumption and fixed investment
and the annual rate of difference in net exports are show in the first
chart. Japan still has a long way to go to recoup the losses from the
recent deep depression. The annual rate of real GDP in the
third quarter was 531.3 trillion yen, compared the 569.1 trillion yen
reached in the first quarter of 2008.
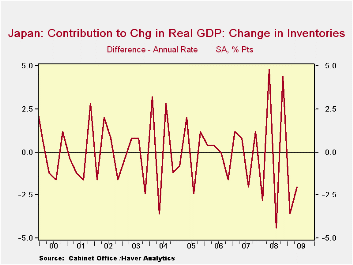
 Although
both net exports and
private consumption continued to increase in the third quarter, their
annual rates of increase were lower than those in the second
quarter. Even with a lower rate decline in Gross Fixed
Domestic Investment, from 10.5% in the second quarter to 1.3 % in the
third quarter, the net effect of these factors does not appear to
account for the sharp increase reported for total GDP in the third
quarter. It should be noted that the data are preliminary and
some of the components, notably the change in inventories, is only
updated during the 2nd preliminary release. Given the
volatility and the large positive and negative contributions of
inventory changes to total growth, as shown in the second chart, it is
highly likely that the missing element in Japan's third quarter growth
was due to inventory accumulation.
Although
both net exports and
private consumption continued to increase in the third quarter, their
annual rates of increase were lower than those in the second
quarter. Even with a lower rate decline in Gross Fixed
Domestic Investment, from 10.5% in the second quarter to 1.3 % in the
third quarter, the net effect of these factors does not appear to
account for the sharp increase reported for total GDP in the third
quarter. It should be noted that the data are preliminary and
some of the components, notably the change in inventories, is only
updated during the 2nd preliminary release. Given the
volatility and the large positive and negative contributions of
inventory changes to total growth, as shown in the second chart, it is
highly likely that the missing element in Japan's third quarter growth
was due to inventory accumulation.
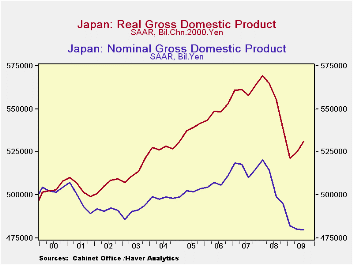
 Deflation
continues to
characterize the Japanese economy. The third chart shows GDP
in nominal and real terms since 2000 when real GDP began to exceed
nominal, indicating a declining price
level.
Deflation
continues to
characterize the Japanese economy. The third chart shows GDP
in nominal and real terms since 2000 when real GDP began to exceed
nominal, indicating a declining price
level.
| Q3 09 | Q2 09 | Q1 09 | Q4 08 | Q3 08 | Q2 08 | Q1 08 | |||
|---|---|---|---|---|---|---|---|---|---|
| Private Consumption (SAAR) | 2.8 | 3.9 | -4.3 | -2.8 | 0.0 | -3.7 | 5.66 | ||
| Fixed Investment (SAAR) | -1.3 | -10.5 | -26.6 | -14.9 | -13.1 | -5.9 | 3.9 | ||
| Net Exports (SAAD) Trillion Yen | 9.8 | 244 | -32.7 | -52.7 | -4.6 | -10.3 | 15.7 | ||
| GDP | 2008 | 2007 | 2006 | 2005 | 2004 | 2003 | 2002 | 2001 | 2000 |
| Real (Trillion 2000Chn Yen) | 556.6 | 560.5 | 547.7 | 536.8 | 526.6 | 512.5 | 505.4 | 504.5 | 503.1 |
| Nominal (Trillion Yen) | 507.6 | 515.8 | 507.4 | 501.7 | 515.8 | 490.3 | 491.3 | 497.7 | 503.0 |

Tom Moeller
AuthorMore in Author Profile »Prior to joining Haver Analytics in 2000, Mr. Moeller worked as the Economist at Chancellor Capital Management from 1985 to 1999. There, he developed comprehensive economic forecasts and interpreted economic data for equity and fixed income portfolio managers. Also at Chancellor, Mr. Moeller worked as an equity analyst and was responsible for researching and rating companies in the economically sensitive automobile and housing industries for investment in Chancellor’s equity portfolio. Prior to joining Chancellor, Mr. Moeller was an Economist at Citibank from 1979 to 1984. He also analyzed pricing behavior in the metals industry for the Council on Wage and Price Stability in Washington, D.C. In 1999, Mr. Moeller received the award for most accurate forecast from the Forecasters' Club of New York. From 1990 to 1992 he was President of the New York Association for Business Economists. Mr. Moeller earned an M.B.A. in Finance from Fordham University, where he graduated in 1987. He holds a Bachelor of Arts in Economics from George Washington University.
More Economy in Brief


