 Global| Dec 11 2009
U.S. Retail Sales Revive AsDiscretionary Spending Improves
by:Tom Moeller
|in:Economy in Brief
Summary
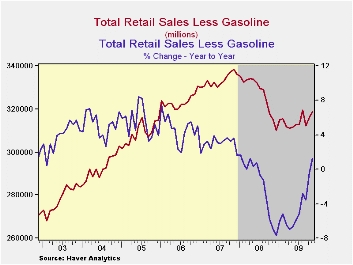
The consumer looks to be gaining strength after earlier torpor. Retail sales last month rose 1.3% after a downwardly revised 1.1% increase during October. The latest increase was stronger than the 0.7% Consensus expectation and it [...]
 The
consumer
looks to be gaining strength after earlier torpor. Retail sales last
month rose 1.3% after a downwardly revised 1.1% increase during
October. The latest increase was stronger than the 0.7% Consensus
expectation and it moved the y/y change in sales into positive
territory for the first time since August of last year. Moreover,
spending on "core" retail sales has improved. Month-to-month changes in
overall sales in recent months have been quite volatile due to auto
sales promotions and rising gasoline prices. Aside from these
distortions, gains in consumer spending have been steady during the
past several months. The retail sales data are available in Haver's USECON
database.
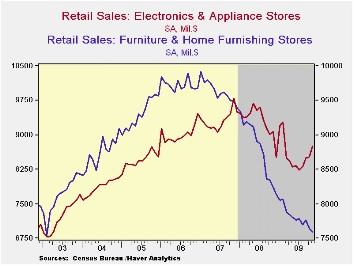 Auto sales
recently firmed after earlier weakness. Last
month, motor vehicle sales rose 1.6% after the 7.1% jump during
October. Though the y/y change improved further into positive
territory, sales were still 23% below the 2007 high. Less autos, sales
jumped 1.2% aided by higher gasoline prices. That increase compares to
an expected 0.4% increase. Higher gasoline prices lifted November fuel
expenditures by 6.0% m/m and by more than one-quarter since December.
Nevertheless, without autos & gasoline retail sales still rose
by 0.6% last month, the third firm gain in the last four
months. These gains raised the y/y change to 0.4% from -4.5%
as of July.
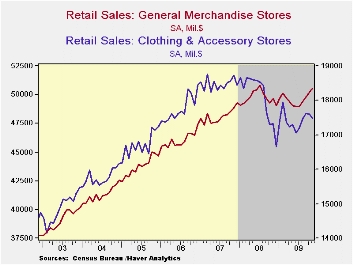 Improvement
in discretionary "core" spending was evident
in the latest data. Sales at general merchandise stores rose 0.8% (1.8%
y/y) during November and roughly matched the firm gains during the
prior three months. The worst of spending in this area was reached
during July when sales were down 3.6% y/y. Sales of electronics also
increased 2.8% (-3.4% y/y) last month following three months of firm
increase. Elsewhere last month, discretionary retail sales were weak.
Furniture store sales fell 0.7% (-7.9% y/y) and have fallen steadily
since early 2007. In soft goods, apparel store sales fell 0.7% after a
revised 0.2% October downtick that previously was reported as an
increase. Nevertheless, the y/y change improved to 0.9% from the 9.7%
decline at the end of last year.
Internet and catalogue purchases were quite firm last month. The 1.2% (8.1% y/y) increase was the fifth strong monthly increase in the last six and the y/y gain contrasted with a 7.6% decline as of April. Restaurant sales rose 0.5% (-0.2% y/y) after falling slightly during the prior five months. Finally, building materials sales reversed the prior months decline and rose 1.5% (-9.3% y/y).
Employment Projections: 2008-2018 from the Bureau of Labor Statistics can be found here
| November | October | September | Y/Y | 2008 | 2007 | 2006 | |
|---|---|---|---|---|---|---|---|
| Total Retail Sales & Food Services (%) | 1.3 | 1.1 | -2.0 | 1.9 | -0.8 | 3.3 | 5.3 |
| Excluding Autos | 1.2 | 0.0 | 0.7 | 1.3 | 2.5 | 3.9 | 6.3 |
| Non-Auto Less Gasoline | 0.6 | 0.1 | 0.6 | 0.4 | 1.6 | 3.6 | 5.7 |
Michigan Consumer Sentiment Recoups Earlier Declines
by Tom Moeller December 11, 2009
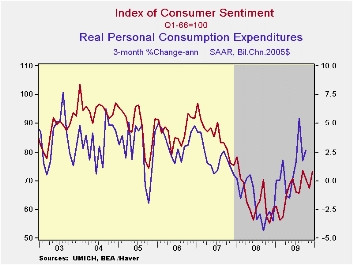 Consumer sentiment began this month by retracing the declines
of October and November. The 8.9% m/m rise in sentiment to a reading of
73.4, as measured by the Reuters/University of Michigan Index of
Consumer Sentiment, also was near the highest since January of last
year. The latest figure surpassed Consensus expectations for a level of
69.0. Sentiment was up by one-third from the low of last fall. During
the last ten years there has been a two-thirds correlation between the
level of sentiment and the three-month change real consumer spending.
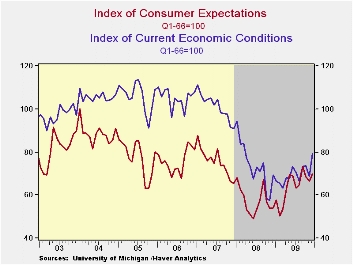 Sentiment about current economic conditions jumped 15.0% from
November to the highest level since March of last year. Assessments of
current financial conditions were quite strong and rose to the highest
since last September. Buying conditions for large household goods,
including furniture, refrigerators, stoves & televisions, also
moved up by 15.8% to the highest level since January 2008.
 The mid-December reading on expected economic conditions also
jumped, but by a lesser 4.8% m/m to the highest level since September.
The outlook for business conditions during the next twelve months
improved sharply and recovered November's decline but the expected
change in personal finances and expected business conditions during the
next five years advanced just modestly. All three of these readings
recently have been flat after sharp improvement early this year.
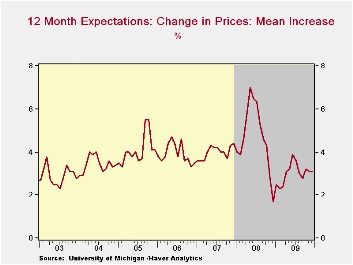
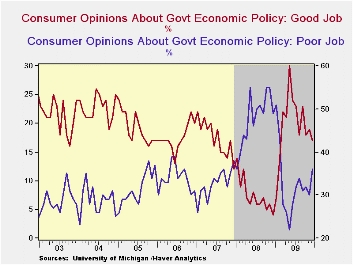
Expected price inflation during the next year held steady m/m at 3.1% but it was up from last December's reading of 1.7%.Respondents' view of government policy, which may eventually influence economic expectations, fell sharply m/m to the lowest level since March. Seventeen percent of respondent thought that a good job was being done by government versus 36% who thought a poor job was being done.
 The Reuters/University of Michigan survey data are not
seasonally adjusted. The reading is based on telephone interviews with
about 500 households at month-end. These mid-month results are based on
about 320 interviews. The summary indexes are in Haver's USECON
database with details in the proprietary UMSCA database.
| University of Michigan | Mid-December | November | October | Dec y/y | 2009 | 2008 | 2007 |
|---|---|---|---|---|---|---|---|
| Consumer Sentiment | 73.4 | 67.4 | 70.6 | 22.1% | 66.3 | 63.8 | 85.6 |
| Current Conditions | 79.1 | 68.8 | 73.7 | 13.8 | 79.1 | 73.7 | 101.2 |
| Expectations | 69.7 | 66.5 | 68.6 | 29.1 | 64.2 | 57.3 | 75.6 |
U.S. Import Prices Jump As Oil Prices Surge
by Tom Moeller December 11, 2009
 Strength
in
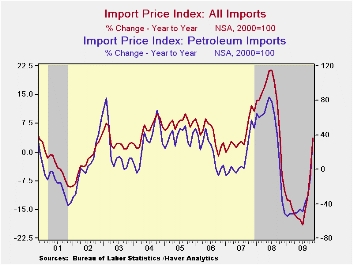
oil prices was the culprit in the 1.7% jump in overall import prices
last month. It exceeded Consensus expectations for a 1.2%
increase.
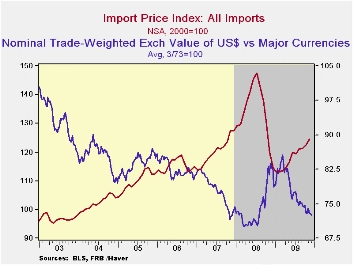
Petroleum prices climbed 6.2% to their highest level since October of last year and have more-than-doubled since the January trough. This month, Brent crude oil prices have moved lower to roughly $71 per barrel from $77 last month. In addition, the latest report from the U.S. Bureau of Labor Statistics indicated that non-oil import prices rose 0.7% after the strong 0.6% October gain. The lower value of the dollar has now helped lift these prices at a 6.5% annual rate during the last three months following a 6.5% y/y decline as of August. (During the last ten years, there has been a negative 81% correlation between the nominal trade-weighted exchange value of the US dollar vs. major currencies and the y/y change in non-oil import prices.)
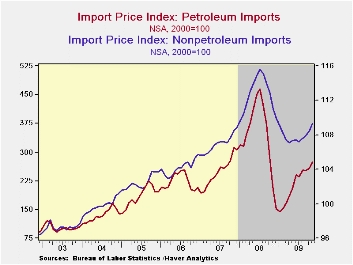 Import
prices break down as
follows: Chemical import prices have been strong during the last three
months, rising at a 26.5% annual rate. Iron & steel prices also
have been strong rising at a 42.6% rate since August. Food prices
increased at a 5.2% rate during the last three months while capital
goods prices posted a modest 1.3% increase (AR) after having been
little-changed from March through August. Prices for nonauto consumer
goods remained weak, down 0.1% last month and up at a 0.4% during the
last three. Durable consumer goods prices rose rose at a 1.4% annual
rate over the last three months, though that is improved from a 6.5%
rate of decline early this year. Furniture prices continued down to the
lowest level since April of last year (-1.5% y/y). Apparel prices have
been flat since July (-0.5% y/y).
 Total
export prices rose a firm 0.8% and at a 3.4% annual rate during the
last three months. The gain was led by a 0.7% rise in nonagricultural
export prices which have turned up versus last year after a 6.6% y/y
decline as of July. Agricultural export prices jumped 3.7% (0.6% y/y).
The import and export price series can be found in Haver's USECON database. Detailed figures are available in the USINT database.
| Import/Export Prices (NSA, %) | November | October | September | Y/Y | 2008 | 2007 | 2006 |
|---|---|---|---|---|---|---|---|
| Import - All Commodities | 1.7 | 0.8 | 0.2 | 3 .7 | 11.5 | 4.2 | 4.9 |
| Petroleum | 6.2 | 2.9 | -0.6 | 35.5 | 37.7 | 11.6 | 20.6 |
| Nonpetroleum | 0.7 | 0.6 | 0.3 | -1.6 | 5.3 | 2.7 | 1.7 |
| Export - All Commodities | 0.8 | 0.2 | -0.2 | 0.6 | 6.0 | 4.9 | 3.6 |
Inflation's acceleration is clear, so is the policy conundrum
by Robert Brusca December 11, 2009
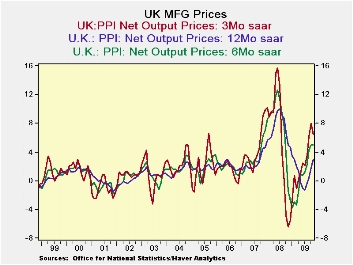
While it would seem to pose a conundrum for the Bank of England, few are expecting any monetary response to the rising inflation trends that are developing in the UK. Both core and headline factory gate prices are showing the same sort of pressure building. Yr/Yr inflation at the producer level already is at 2.9% for the headline and at 2% for the core, levels that would be at or above the ceiling rate were this the CPI (HICP; actually the HICP itself is running at a 2% pace as of September). PPI price trends took a bit of a break in November with the headline rate below its pace of the previous three months; the core showed its smallest rise in four months.
The UK economy is still struggling and getting recovery going is still job-one. So it is not expected that the BOE will react to the rising inflation rate. Indeed, it is hoped that the weakness in the economy will keep these pressures from building and that the current rise proves to be a rogue wave of inflation that is not followed by any others and that dissipates harmlessly on the shores of discretion. That prognosis may prove be correct, but for the moment it seems a bit of wishful thinking. Still, if I were a BOE governor I doubt I would have the stomach to attack inflation now under the circumstances. Even so that does not make it the right thing to do. It is a conundrum of the first order.
| UK PPI MFG net output prices | |||||||
|---|---|---|---|---|---|---|---|
| %m/m | %-SAAR | ||||||
| NOV-09 | OCT-09 | SEP-09 | 3-mo | 6-mo | 12-mo | 12-moY-Ago | |
| MFG | 0.3% | 0.6% | 0.7% | 6.5% | 5.0% | 2.9% | 5.0% |
| Core | 0.1% | 0.5% | 0.5% | 4.8% | 2.7% | 2.0% | 5.1% |
| Core: ex food beverages, tobacco & Petroleum | |||||||
Tom Moeller
AuthorMore in Author Profile »Prior to joining Haver Analytics in 2000, Mr. Moeller worked as the Economist at Chancellor Capital Management from 1985 to 1999. There, he developed comprehensive economic forecasts and interpreted economic data for equity and fixed income portfolio managers. Also at Chancellor, Mr. Moeller worked as an equity analyst and was responsible for researching and rating companies in the economically sensitive automobile and housing industries for investment in Chancellor’s equity portfolio. Prior to joining Chancellor, Mr. Moeller was an Economist at Citibank from 1979 to 1984. He also analyzed pricing behavior in the metals industry for the Council on Wage and Price Stability in Washington, D.C. In 1999, Mr. Moeller received the award for most accurate forecast from the Forecasters' Club of New York. From 1990 to 1992 he was President of the New York Association for Business Economists. Mr. Moeller earned an M.B.A. in Finance from Fordham University, where he graduated in 1987. He holds a Bachelor of Arts in Economics from George Washington University.
More Economy in Brief
 Global| Feb 05 2026
Charts of the Week: Balanced Policy, Resilient Data and AI Narratives
by:Andrew Cates


