 Global| Feb 12 2009
U.S. Retail Sales Recover ModestlyFollowing Six Months of Decline
by:Tom Moeller
|in:Economy in Brief
Summary
January retail sales unexpectedly rose 1.0%. However, the increase recovered only part of the little-revised 3.0% decline during December which capped a six-month slide in sales. The meekness of the rebound left the 9.7% year-to-year [...]
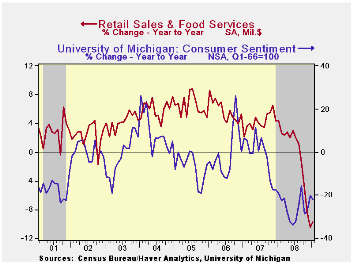
January retail sales unexpectedly rose 1.0%. However, the increase recovered only part of the little-revised 3.0% decline during December which capped a six-month slide in sales. The meekness of the rebound left the 9.7% year-to-year decline as the postwar record and it followed declines of 3.0%, 2.4% and 3.4% during the prior three months. Consensus expectations had been for a decline of 0.8% decline in January sales. The retail sales data are available in Haver's USECON database.
A surprising 1.8% rise in motor vehicle sales accounted for part of the recovery in overall retail sales last month. The gain contrasted with the already reported 7.1% decline in unit sales of light vehicles. Gasoline service station sales also rose a surprising 2.6% which was boosted by the seasonal factor. Excluding these two areas, retail sales rose 0.8% after a 1.8% December decline. Year-to-year, excluding autos and gasoline, sales fell 2.0% which also was a record.
Sales at gasoline service stations rose 2.6% (-35.5% y/y) after a 15.6% decline during December. The rise was fueled (pardon the pun) by a 5.5% month-to-month rise in the pump price for gasoline.Gas prices are up another 6.6% so far in February.
Modest rebounds in retail sales were widely evident throughout
the latest report. Sales at furniture and electronics &
appliance stores recovered 0.7% after the huge 3.8% December decline.
That left sales down 11.1% year-to-year. Furniture store sales fell
1.3% and by 14.3% year-to-year while sales of electronics &
appliances rose 2.6% (-7.8% y/y) after a downwardly revised 5.8%
December decline.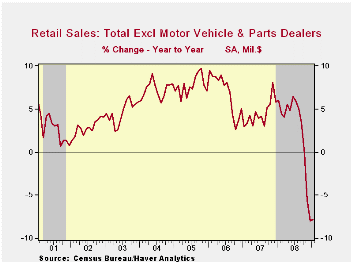
In the soft goods area, apparel store sales recovered 1.6% (-10.3% y/y) after their 4.0% December drop which was downwardly revised. At general merchandise stores, sales rose 1.1% (1.5% y/y) and recovered all of their December decline.
Dining out was a bit more in vogue and it registered a 0.8% recovery after the 1.3% December decline. The 1.8% year-to-year increase, however, remained one-half of the 2008 pace and down sharply from the 5%-to-6% gains of the prior several years.
Building materials sales continue to tumble with the drop off in housing. Sales fell 3.2% last month (-12.1% y/y) and the drop was similar in size to the declines of the prior three months and it was the sixth consecutive tumble.
Sales at nonstore (internet) retailers made up their December decline with a 2.7% (0.1% y/y) increase. That followed six consecutive months of decline.
| January | December | November | Y/Y | 2008 | 2007 | 2006 | |
|---|---|---|---|---|---|---|---|
| Retail Sales & Food Services (%) | 1.0 | -3.0 | -2.4 | -9.7 | -0.5 | 4.2 | 5.8 |
| Excluding Autos | 0.9 | -3.2 | -2.6 | -6.6 | 2.7 | 4.6 | 6.8 |
| Less Gasoline | 0.8 | -1.8 | -0.3 | -2.0 | 1.8 | 4.2 | 6.2 |
IP Drops Sharply Across Sectors in the Euro Area
by Robert Brusca February 12, 2009
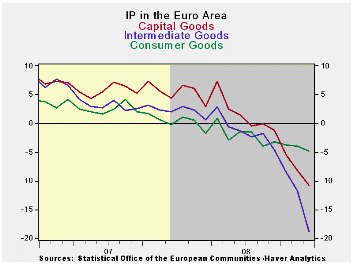
Industrial production fell by a sharp 3% in December and is
having its sharpest fall since the Euro Area data series began. The
progressive growth rates show that GDP is getting weaker and weaker
over shorter periods. In the fourth quarter IP in the zone is down at a
20.7% annual rate. Consumer output is down by the least at a -6.4%
pace. Intermediate goods output is down at an outsized -30% annual pace
in Q4. Capital goods output is off at a -21.2% annual rate. The country
level data show year-over-year MFG IP declines are fairly uniform
across countries. We are looking to very weak GDP results for EMU and
its member nations.
| Euro Area MFG IP | ||||||||||
|---|---|---|---|---|---|---|---|---|---|---|
| Saar except m/m | Mo/Mo | Dec 08 |
Nov 08 |
Dec 08 |
Nov 08 |
Dec 08 |
Nov 08 |
|||
| Euro Area Detail | Dec 08 |
Nov 08 |
Oct 08 |
3Mo | 3Mo | 6mo | 6mo | 12mo | 12mo | Q4 |
| MFG | -3.1% | -2.4% | -1.8% | -25.6% | -22.5% | -17.8% | -13.3% | -12.2% | -8.3% | -20.7% |
| Consumer | -0.7% | -0.7% | -0.2% | -6.5% | -6.5% | -6.0% | -3.7% | -4.8% | -3.9% | -6.4% |
| C-Durables | -2.8% | -2.8% | -1.9% | -26.5% | -25.6% | -19.6% | -14.6% | -13.4% | -10.5% | |
| C-Nondurables | -0.9% | -0.2% | 0.1% | -4.1% | -3.7% | -4.8% | -1.8% | -3.9% | -2.6% | |
| Intermediate | -5.7% | -3.6% | -2.8% | -39.0% | -32.7% | -27.5% | -19.9% | -18.8% | -11.8% | -30.9% |
| Capital | -2.5% | -2.6% | -2.4% | -25.9% | -24.3% | -16.9% | -13.8% | -10.8% | -8.2% | -21.2% |
| Main E-zone Countries and UK IP in MFG | ||||||||||
| Mo/Mo | Dec 08 |
Nov 08 |
Dec 08 |
Nov 08 |
Dec 08 |
Nov 08 |
||||
| MFG Only | Dec 08 |
Nov 08 |
Oct 08 |
3Mo | 3Mo | 6mo | 6mo | 12mo | 12mo | Q-2- Date |
| Germany: | -5.3% | -3.8% | -2.1% | -36.5% | -32.1% | -23.8% | -14.1% | -13.1% | -7.2% | -26.9% |
| France: IP ex Construction | -1.8% | -2.8% | -3.8% | -28.8% | -25.6% | -15.1% | -13.4% | -11.1% | -9.1% | -24.1% |
| Italy | -2.7% | -3.2% | -2.2% | -28.1% | -30.2% | -22.8% | -18.1% | -13.1% | -10.6% | -26.0% |
| Spain | 2.7% | -9.4% | -2.0% | -30.9% | -30.7% | -10.1% | -23.2% | -15.0% | -17.2% | -29.8% |
| UK: EU member | -2.2% | -3.0% | -1.6% | -24.1% | -20.3% | -16.6% | -14.0% | -10.2% | -8.4% | -19.1% |
U.S. Initial Claims For Unemployment Insurance Slipped From Recent High
by Tom Moeller February 12, 2009
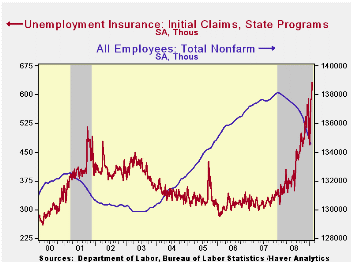
U.S. labor market conditions continued dismal as the Labor
Department indicated that initial claims for unemployment insurance
slipped just 8,000 to 623,000 after an upwardly revised 40,000 increase
during the prior week. The latest level again surpassed Consensus
expectations for 610,000 initial claims. Initial claims continue to be
the highest since late during the sharp recession of 1981-82. During
that recession, real GDP fell by 2.9% peak-to-trough.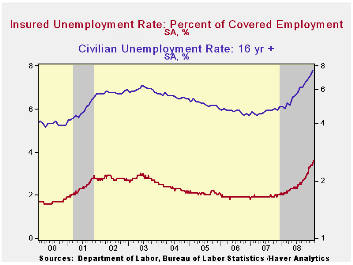
The Labor Department indicated that the largest increases in initial claims for the week ending January 31 were in California (+20,001), North Carolina (+8,663), Ohio (+4,738), Georgia (+4,392), and Kansas (+3,232), while the largest decreases were in Virginia (-1,937), New Jersey (-1,551), Missouri (-1,370), Oklahoma (-1,199), and Connecticut (-1,000).
Labor market stress was further indicated by an increase to 4,810,000 continuing claims for unemployment insurance. The latest was another record. The series dates back to 1966. The four-week average of continuing claims rose 73,800 to 4,745,250. Continuing claims provide some indication of workers' ability to find employment and they lag the initial claims figures by one week.
Though the latest level of continuing claims was a record, the labor force has grown as well. Therefore, the insured rate of unemployment was not at a new high. It remained stable at 3.6% which was, however, the highest since 1983. The highest insured unemployment rates in the week ending January 24 were Michigan (7.4 percent), Oregon (6.9), Idaho (6.8), Wisconsin (6.1), Pennsylvania (5.9), Nevada (5.7), Montana (5.6), Indiana (5.5), Alaska (5.4), New Jersey (5.4), and Rhode Island (5.4).
| Unemployment Insurance (000s) | 02/06/09 | 01/31/09 | 01/17/09 | Y/Y | 2008 | 2007 | 2006 |
|---|---|---|---|---|---|---|---|
| Initial Claims | 623 | 631 | 591 | 83.8% | 420 | 321 | 313 |
| Continuing Claims | -- | 4,810 | 4,799 | 78.5% | 3,342 | 2,552 | 2,459 |
U.S. Business Inventory Cutbacks Gained Steam
by Tom Moeller February 12, 2009
 Total business inventories
fell 1.3% during December after a
downwardly revised November decline. The latest drop was the
fourth in as many months and the rise of 0.9% year-to-year was the
weakest since early-2004. The recent cutback in inventory accumulation
reflects the 11.8% y/y drop in business sales. During the
last three months inventories have been cut at an 11.4% rate as sales
have fallen at a 40.9% annual rate. The mismatch
between inventory and sales growth caused the December inventory/sales
ratio to surge further to 1.44, its highest level since the recession
of 2001. What's more is that the increase in the ratio during
the last year is the swiftest since 1982. The rise ended a twenty-eight
year downtrend.
Total business inventories
fell 1.3% during December after a
downwardly revised November decline. The latest drop was the
fourth in as many months and the rise of 0.9% year-to-year was the
weakest since early-2004. The recent cutback in inventory accumulation
reflects the 11.8% y/y drop in business sales. During the
last three months inventories have been cut at an 11.4% rate as sales
have fallen at a 40.9% annual rate. The mismatch
between inventory and sales growth caused the December inventory/sales
ratio to surge further to 1.44, its highest level since the recession
of 2001. What's more is that the increase in the ratio during
the last year is the swiftest since 1982. The rise ended a twenty-eight
year downtrend.
Retailers cut inventories 1.0% in December and at an
11.7% rate during the last three months, the swiftest since
2001.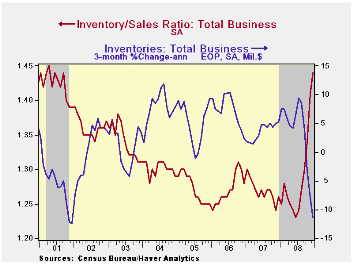 Motor vehicle inventories continued to lead the
decumulation and fell at a 15.8% rate during the last three months.
Nevertheless, the inventory-to-sales ratio for automobiles remained
near its historic high at 2.59. So unless sales recover soon, expect
further production cuts to reduce the ratio.
Motor vehicle inventories continued to lead the
decumulation and fell at a 15.8% rate during the last three months.
Nevertheless, the inventory-to-sales ratio for automobiles remained
near its historic high at 2.59. So unless sales recover soon, expect
further production cuts to reduce the ratio.
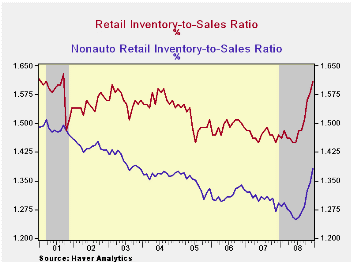
Outside of autos, retailers continued with their reduction of unsold goods. Furniture, home furnishings & electronics inventories fell 1.2% in December and they are off 5.5% during the past year. Apparel retailers cut aggressively as well. The 0.6% December decline matched the November inventory cutback and they're off 2.5% year-to-year. General merchandise inventories fell 1.1% (-2.7% y/y) during December. Overall, the inventory-to-sales ratio in the nonauto retail sector rose during December to its highest level since 2003.
| Business Inventories (%) | December | November | October | Y/Y | 2008 | 2007 | 2006 |
|---|---|---|---|---|---|---|---|
| Total | -1.3 | -1.1 | -0.6 | 0.9 | 0.9 | 4.1 | 6.5 |
| Retail | -1.0 | -1.8 | -0.2 | -2.8 | -2.8 | 2.9 | 3.5 |
| Retail excl. Auto | -1.0 | -1.5 | -0.1 | -1.5 | -1.5 | 2.9 | 4.9 |
| Wholesale | -1.4 | -0.9 | -1.2 | 3.4 | 3.4 | 5.9 | 8.3 |
| Manufacturing | -1.4 | -0.5 | -0.6 | 2.6 | 2.6 | 3.7 | 8.2 |

Tom Moeller
AuthorMore in Author Profile »Prior to joining Haver Analytics in 2000, Mr. Moeller worked as the Economist at Chancellor Capital Management from 1985 to 1999. There, he developed comprehensive economic forecasts and interpreted economic data for equity and fixed income portfolio managers. Also at Chancellor, Mr. Moeller worked as an equity analyst and was responsible for researching and rating companies in the economically sensitive automobile and housing industries for investment in Chancellor’s equity portfolio. Prior to joining Chancellor, Mr. Moeller was an Economist at Citibank from 1979 to 1984. He also analyzed pricing behavior in the metals industry for the Council on Wage and Price Stability in Washington, D.C. In 1999, Mr. Moeller received the award for most accurate forecast from the Forecasters' Club of New York. From 1990 to 1992 he was President of the New York Association for Business Economists. Mr. Moeller earned an M.B.A. in Finance from Fordham University, where he graduated in 1987. He holds a Bachelor of Arts in Economics from George Washington University.
More Economy in Brief


