 Global| Aug 13 2009
U.S. Retail Sales Post Surprising, Across-the-Board Declines
by:Tom Moeller
|in:Economy in Brief
Summary
Price discounting apparently wasn't enough last month to entice consumers to open their wallets and spend. July retail sales slipped 0.1% after an upwardly revised 0.8% June increase that was fueled by higher gasoline prices. The July [...]
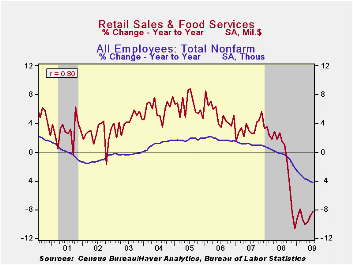
Price discounting apparently wasn't enough last month to entice consumers to open their wallets and spend. July retail sales slipped 0.1% after an upwardly revised 0.8% June increase that was fueled by higher gasoline prices. The July decline in total sales fell well short of expectations for a 0.6% increase. The retail sales data are available in Haver's USECON database.
The "Cash-For-Clunkers" auto sales program was successful in lifting sales of motor vehicles by 2.4% (-7.3% y/y) in dollar terms as unit vehicle sales jumped 15.8% m/m. Without the auto sector, retail sales fell 0.6%.
Elsewhere, gas prices reversed just a piece of earlier increases with a 4.0% (NSA) decline to $2.53 per gallon. As a result, sales of gasoline service stations fell 2.1% after a 6.3% jump during June.
Distortion of the underlying retail spending picture is an
obvious result of auto & gasoline sales, but the basic trend is
not vibrant. Retail sales excluding both autos and gasoline fell 0.4%
(-4.6% y/y) last month for the fifth consecutive monthly decline.
Including a strong January, these sales have risen at just a 0.2%
annual rate since December following last year's 2.8% 12-month decline.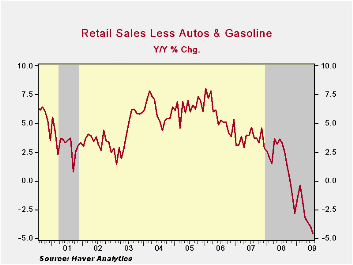
Discretionary spending continued under pressure as the job market remained depressed. Sales at furniture, electronics & appliance stores fell 1.2% (-13.8% y/y) for the fifth consecutive monthly drop. Earlier small monthly gains were revised away. Furniture store sales alone fell 0.9% (-12.9% y/y) while sales of electronics & appliances dropped 1.4% (-14.6% y/y). So far this year, these hard good sales have fallen at a 7.8% annual rate after last year's 4.4% decline. In the soft goods area, apparel store sales increased a slight 0.6% (-7.6% y/y) while sales at general merchandise stores fell 0.8% for the fifth consecutive monthly decline (-4.7% y/y).
Internet and catalogue purchases inched up after a firm June. July sales of non-store retailers rose 0.1% (-5.2% y/y) following an upwardly revised 1.5% jump during June. So far this year sales have risen at a 3.2% rate after rising 2.8% in 2008. Finally, restaurant sales made up their June decline with a 0.4% increase. So far this year they've risen a a 4.0% annual rate.
Building materials sales continued their slump, falling 2.1% last month for the sixth monthly decline this year and they were down at a 9.1% annual rate since December.
Bank Credit Standards from the Federal Reserve Bank of Philadelphia can be found here.
| July | June | May | Y/Y | 2008 | 2007 | 2006 | |
|---|---|---|---|---|---|---|---|
| Retail Sales & Food Services (%) | -0.1 | 0.8 | 0.5 | -8.3 | -0.7 | 3.3 | 5.3 |
| Excluding Autos | -0.6 | 0.5 | 0.2 | -8.5 | 2.5 | 3.9 | 6.3 |
| Less Gasoline | -0.4 | -0.1 | -0.2 | -4.6 | 1.6 | 3.6 | 5.7 |
by Tom Moeller August 13, 2009
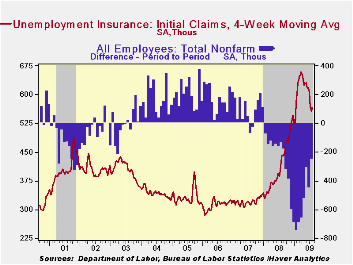
The latest figures from the Labor Department indicate that initial claims for unemployment insurance increased slightly to 558,000 last week after an upwardly revised 554,000 during the prior week. For all of July, claims fell 9.3% from June but since the beginning of the month they moved sideways. The four-week moving average of claims, which smoothes out some of the volatility in the weekly numbers, ticked up to 565,000 but was still near its lowest level since late-January. A decline in weekly claims to 545,000 had been expected.
The Labor Department indicated that the largest increases in initial claims for the week ending Aug. 1 were in Alabama (+721, 58.4% y/y), Washington (+692, 47.6% y/y), Nebraska (+306, 40.4% y/y), Kentucky (+247, 46.9% y/y), and Delaware (+157, 43.0% y/y), while the largest decreases were in California (-7,258, -16.4% y/y), Michigan (-7,031, -20.9% y/y), Tennessee (-4,391, +30.9% y/y), Florida (-3,358, -6.1% y/y), and Georgia (-2,538, +19.8% y/y).
The lower level of initial claims has been accompanied by
lower continuing claims for unemployment insurance which probably owes
partly to the exhaustion of benefits. For the latest week, they
declined 141,000 and since their peak last month they've fallen 702,000
or 10.2%. Continuing claims provide an indication of workers' ability
to find employment and the level of 6,202,000 claims is up
sharply from the year-ago level. The four-week average of
continuing claims fell back to 6,259,250 and that was the lowest since
late-April. The series dates back to 1966.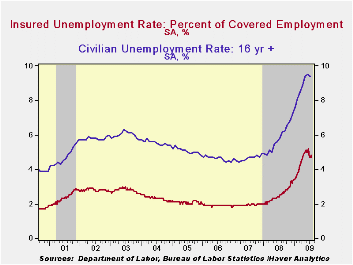
The insured rate of unemployment remained at 4.7% which was the lowest level since mid-April. During the last ten years, there has been a 93% correlation between the level of the insured unemployment rate and the overall rate of unemployment published by the Bureau of Labor Statistics.
The highest insured unemployment rates in the week ending July 25 were in Michigan (6.8 percent), Puerto Rico (6.7), Oregon (6.3), Pennsylvania (6.2), Nevada (6.0), Wisconsin (5.6), Connecticut (5.5), California (5.4), New Jersey (5.4), and Illinois (5.3). The lowest rates were in South Dakota (1.4) and North Dakota (1.6), Virginia (2.5), Wyoming (3.0), Texas (3.0), Maine (3.2), Colorado (3.4), Maryland (3.6), Minnesota (3.7), Florida (4.3), Mississippi (4.3), New York (4.4) and Georgia (4.3).
The unemployment insurance claims data is available in Haver's WEEKLY database and the state data is in the REGIONW database.
| Unemployment Insurance (000s) | 08/07/09 | 07/31/09 | 07/24/09 | Y/Y | 2008 | 2007 | 2006 |
|---|---|---|---|---|---|---|---|
| Initial Claims | 558 | 554 | 589 | 26.8% | 420 | 321 | 313 |
| Continuing Claims | -- | 6,202 | 6,343 | 82.6% | 3,342 | 2,552 | 2,459 |
| Insured Unemployment Rate (%) | -- | 4.7 | 4.8 | 2.5 | 2.5 | 1.9 | 1.9 |
by Tom Moeller August 13, 2009
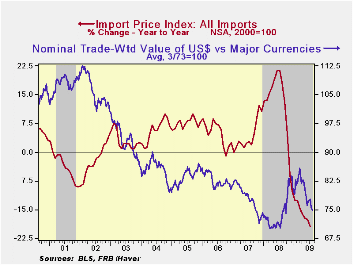
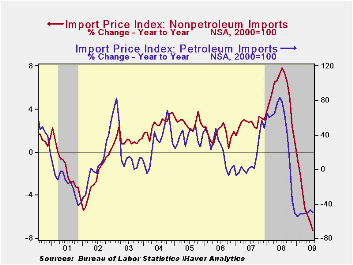
U.S. import prices last month declined a slightly more-than-expected 0.7%. Prices have fallen sharply since last year due to lower oil prices, the firmer dollar and the global economic recession.
The recent gain in petroleum prices took a breather last month and fell 2.8% after four consecutive months of double-digit increase. This month, however, crude oil prices have more than reversed the earlier decline with a rise to an average $71.75 per barrel.
Non-oil import prices reversed course last month with a 0.2% decline and since March prices have been roughly unchanged. This stability compares to three-month price declines of 3.5% as recently as this past January. (During the last ten years, there has been a negative 81% correlation between the nominal trade-weighted exchange value of the US dollar vs. major currencies and the y/y change in non-oil import prices.)
 Food prices took an about face last month with a 0.8% decline
(-7.3% y/y) that reversed the gains during the prior two months. Prices
for nonauto consumer goods fell 0.4% (-1.2% y/y). Durable consumer
goods prices fell 0.3% (-1.6% y/y) as household goods fell and home
entertainment equipment prices also were down by 1.4% y/y. Apparel
prices reversed earlier stability and continued down with a 0.5% flop
(-0.6% y/y).
Food prices took an about face last month with a 0.8% decline
(-7.3% y/y) that reversed the gains during the prior two months. Prices
for nonauto consumer goods fell 0.4% (-1.2% y/y). Durable consumer
goods prices fell 0.3% (-1.6% y/y) as household goods fell and home
entertainment equipment prices also were down by 1.4% y/y. Apparel
prices reversed earlier stability and continued down with a 0.5% flop
(-0.6% y/y).
 Capital goods import prices during July increased a modest
0.2% (-1.5% y/y) after little change during the prior three months.
Excluding computers, capital goods prices rose 0.2% but they're still
down 0.3% y/y. Prices of computers, peripherals & accessories
inched up 0.3% but they're down 4.8% during the last year.
Capital goods import prices during July increased a modest
0.2% (-1.5% y/y) after little change during the prior three months.
Excluding computers, capital goods prices rose 0.2% but they're still
down 0.3% y/y. Prices of computers, peripherals & accessories
inched up 0.3% but they're down 4.8% during the last year.
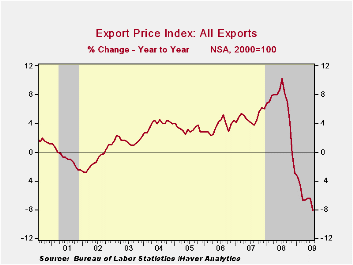
Total export prices reversed some of their earlier strengthening with a 0.3% decline. The latest overall drop was led by a 4.9% (-22.3% y/y) decline in agricultural prices which reversed all of the June increase. Nonagricultural export prices firmed again and posted a 0.2% uptick but they're still down 6.5% y/y.
| Import/Export Prices (NSA, %) | July | June | Y/Y | 2008 | 2007 | 2006 |
|---|---|---|---|---|---|---|
| Import - All Commodities | -0.7 | 2.6 | -19.3 | 11.5 | 4.2 | 4.9 |
| Petroleum | -2.8 | 16.2 | -49.9 | 37.7 | 11.6 | 20.6 |
| Nonpetroleum | -0.2 | 0.2 | -7.3 | 5.3 | 2.7 | 1.7 |
| Export - All Commodities | -0.3 | 1.0 | -8.1 | 6.0 | 4.9 | 3.6 |
by Carol Stone August 13, 2009
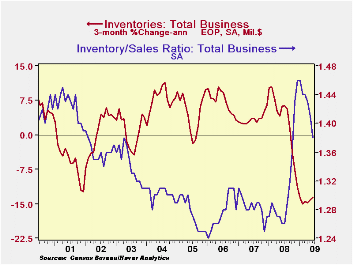
Business inventories have continued to fall sharply through June, and at all three levels of distribution, manufacturing, wholesale and retail. Total inventories were off 1.1% in June alone, following 1.2% in May and 1.3% in April. The level at end-June was down an amazing 9.8% from a year ago. Factory stocks were off 0.8% in the month and 8.5% from June 2008, wholesale was down 1.7% in June and 10.3% on the year and retail 1.1% in June and 10.8% from June 2008.
No small part of this shrinkage is in the auto industry alone.
Wholesale and retail motor vehicle and parts stocks together were down
2.4% in June and 21.9% from June 2008. Apart from auto dealers, retail
inventories are down on the year by "only" 5.2% and total business
stocks by 7.9%.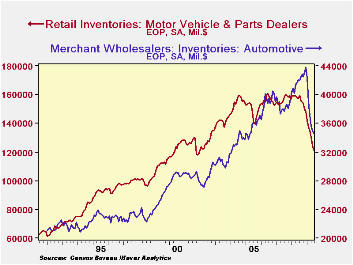
There is a distinctly encouraging note in this report on business inventories and sales for June. Sales rose. They were up 0.9% from May, the first month-on-month increase since July 2008. All three sectors participated in the gain, and total sales excluding the auto industry rose 0.8%. The sales improvement helped bring the inventory/sales ratio down to 1.38 from 1.41 in May, the lowest since last October. The auto industry has contributed to this swing too, but in June, the I/S ratio for non-auto industries fell to 1.33 from 1.35 and was also the lowest figure since October.
Today's accompanying data on retail sales for July remind us that the sales picture remains fragile, though [see Tom Moeller's summary of that], so it's clearly premature to conclude that anything fundamental has shifted in the total sales and inventory picture. But at least this one month looks better, and getting the I/S ratios down more puts the economy another step closer to recovery.
The business sales and inventory data are available in Haver's USECON database.
| Business Inventories (%) | June | May | April | Y/Y | 2008 | 2007 | 2006 |
|---|---|---|---|---|---|---|---|
| Total | -1.1 | -1.2 | -1.3 | -9.8 | 0.6 | 4.0 | 6.4 |
| Retail | -1.0 | -1.7 | -1.4 | -10.8 | -3.1 | 2.5 | 3.3 |
| Retail excl. Auto | -0.3 | -0.7 | -0.7 | -5.2 | -1.8 | 2.7 | 4.7 |
| Wholesale | -1.7 | -1.2 | -1.3 | -10.3 | 3.1 | 6.2 | 8.2 |
| Manufacturing | -0.8 | -0.8 | -1.2 | -8.5 | 2.1 | 3.7 | 8.2 |
by Robert Brusca August 13, 2009
European growth figures continue to be weak when we log the
indicators month by month but if instead we complete a formal GDP
presentation, Germany and France have exited recession while the EMU
GDP drop is only -0.1% in Q2 of 2009, a drop at an annual rate of
-0.4%. EMU’s GDP decline in Q2 is less than the drop in the US but
Europe’s Yr/Yr decline has been worse at -4.7% compared to the US
year-over-year loss of -3.9%.
In the US the Fed is less downbeat - At
its meeting yesterday the Fed implied that the recession in the US was
ending but did not take the step of saying in any clear voice that
recovery was beginning. It issued in a vague voice the statement saying
that activity was leveling off. In Q2 some of Europe, at least, is
doing better than that.
GDP as the standard - The contrast
between what GDP sees and what monthly indicators show is an important
one to keep in mind. GDP accounting has its peculiar elements. Fewer
imports boost GDP even though there is no direct impact on domestic
output (there is less bought from abroad and so fewer payments made to
foreigners- all things equal fewer imports mean higher sales by
domestic agents for the same GDP). And inventories cut at slower pace,
add to GDP growth even though they are still being cut.
Indicators can lag - Jobs tend to trail
activity shifts so the economy will be in recovery before job growth is
even positive. In the case of Europe its purchaser induces and the EU
Economic indicators from the EU Commission are woefully weak and seem
inconsistent with the notion that the recession is ending even if just
in Germany and France. But that is the way recessions sometimes end.
Indicators really do lag in this cycle -
To put it differently early recovery periods often do not look very
different from end recession periods. That is not surprising because
they are chronological neighbors. What makes recovery so different is
where it is headed compared to the recession period. Even so, the
indicators of economic performance in Europe are uncharacteristically
weak for the recession to be ending. Even those in Germany and in
France are lacking. The GDP rebounds hardly seems like they can be from
the same countries as the ones that have produced the indicators they
have up to mid-year.
What indicators have been telling us- To
begin with we have no detail on GDP in Europe just the few things that
might be said at press conferences where the data are released.
Industrial data in EMU as well as in Germany and France, in particular,
continue to be very weak. The German and French economic sentiment
readings which are a weighted average of the EU Commission’s underlying
sector indices rank in the bottom 20th percentile of their respective
rage of values. The German and French readings are up about 10% or so
from their weakest readings in the recession on this score. The EU
Commission indices are from underlying diffusion data. All continue to
show deep contractions across are all sectors. Germany and France show
GDP that is rising, nonetheless. Apparently the change in the EMU index
is more important that the level of the index even though it is a
diffusion index that has to turn positive to signal sector growth and
all sectors industrial, retail, services, construction and consumer are
weak.
German’s IFO - Germany has its own IFO
survey with a diffusion component and for July its services reading
just barely turned positive.
More indicators - The NTC/Markit readings
are ISM type readings where a level above 50 denotes expansion. For EMU
in June the NTC reading stood at 42.4 for MFG and 44.5 for Services.
Both of these indices register declines as they are below 50. For
Germany, an economy that is showing positive GDP growth in Q2, its
NTC/Market diffusion index stood at 40.8 and was ins the bottom 40
percentile of its range of readings. France at 45.9 also signaled a
declining MFG sector but its index was closer to neutral standing in
the 49th percentile of its range, despite its low raw diffusion level.
The service sectors in France and Germany were weak in June as well,
with raw diffusion readings 45 and 47 respectively. Those readings
ranked in the lower third of each country’s respective historic
experience.
GDP does not seem to have widespread support -
In short the industrial data and service sector data we have do not
confirm the message from GDP in EMU. We could go through a litany of
consumer confidence data as well, as they are weak too. If Europe is
recovering (France and Germany, any way) it must be the government
spending that is boosting the economy coupled with lower imports and
inventories that are being cut by less than before –all these are what
I would terms passive augmentations of GDP. The active augmentation
from more consumer spending and more business investment has not begun.
Inventories are likely adding to GDP growth but not by actively being
built.
Exports and government are probably the main drivers -
We have seen episodic country reports that have revealed exports have
begun to rise. So the economies that are in recovery may now be firing
on two cylinders exports and the government sector. It’s not a very
wide base for growth yet. But it is also the support within EMU that is
helping to cut the drop in the formal measure of GDP. Progress is being
made but it does look like the sort of progress that usually marks the
ends of recessions. Too many European, German and French sectors are
just too weak.
| E-Area and main G-10 country GDP Results | |||||||
|---|---|---|---|---|---|---|---|
| Quarter over quarter-Saar | Year/Year | ||||||
| GDP | Q2-09 | Q1-09 | Q4-08 | Q2-09 | Q1-09 | Q4-08 | Q3-08 |
| EMU-15 | -0.4% | -9.7% | -6.9% | -4.7% | -4.9% | -1.7% | 0.5% |
| Austria | #N/A | -3.3% | -3.9% | #N/A | -3.4% | 0.2% | 2.0% |
| France | 1.4% | -5.3% | -5.5% | -2.6% | -3.4% | -1.6% | 0.1% |
| Germany | 1.3% | -13.4% | -9.4% | -5.9% | -6.7% | -1.8% | 0.8% |
| Greece | 1.3% | -4.7% | 1.2% | -0.2% | 0.3% | 2.4% | 2.7% |
| Italy | -1.9% | -10.3% | -8.3% | -6.0% | -6.0% | -3.0% | -1.3% |
| The Netherlands | -3.4% | -10.3% | -4.1% | -4.9% | -4.2% | -0.8% | 1.7% |
| Portugal | #N/A | -6.2% | -7.1% | #N/A | -3.7% | -2.0% | 0.3% |
| Spain | #N/A | -7.4% | -3.8% | #N/A | -3.0% | -0.7% | 0.9% |
| UK | -3.1% | -9.2% | -7.0% | -5.6% | -4.9% | -1.8% | 0.5% |
| US | -1.0% | -6.4% | -5.4% | -3.9% | -3.3% | -1.9% | 0.0% |
| Japan | #N/A | -14.2% | -13.5% | #N/A | -8.4% | -4.4% | -0.3% |
| Switzerland | #N/A | -3.2% | -2.2% | #N/A | -1.6% | -0.4% | 1.2% |

Tom Moeller
AuthorMore in Author Profile »Prior to joining Haver Analytics in 2000, Mr. Moeller worked as the Economist at Chancellor Capital Management from 1985 to 1999. There, he developed comprehensive economic forecasts and interpreted economic data for equity and fixed income portfolio managers. Also at Chancellor, Mr. Moeller worked as an equity analyst and was responsible for researching and rating companies in the economically sensitive automobile and housing industries for investment in Chancellor’s equity portfolio. Prior to joining Chancellor, Mr. Moeller was an Economist at Citibank from 1979 to 1984. He also analyzed pricing behavior in the metals industry for the Council on Wage and Price Stability in Washington, D.C. In 1999, Mr. Moeller received the award for most accurate forecast from the Forecasters' Club of New York. From 1990 to 1992 he was President of the New York Association for Business Economists. Mr. Moeller earned an M.B.A. in Finance from Fordham University, where he graduated in 1987. He holds a Bachelor of Arts in Economics from George Washington University.
More Economy in Brief


