 Global| Jan 15 2008
U.S. Retail Sales Miss Expectations
by:Tom Moeller
|in:Economy in Brief
Summary
U.S. retail sales fell 0.4% last month and missed expectations for no change. November's gain was revised down slightly to 1.0% and the October figure also was revised down slightly to no change. Excluding autos sales similarly fell [...]
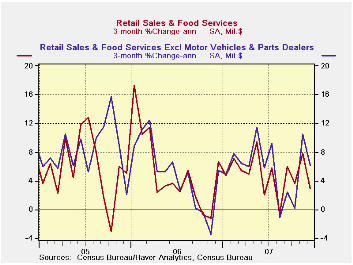
U.S. retail sales fell 0.4% last month and missed expectations for no change. November's gain was revised down slightly to 1.0% and the October figure also was revised down slightly to no change.
Excluding autos sales similarly fell short of expectations for no change and fell 0.4% after slight downward revisions during the prior two months.
Less gasoline & autos, sales fell 0.2% and prior
months' results were taken down.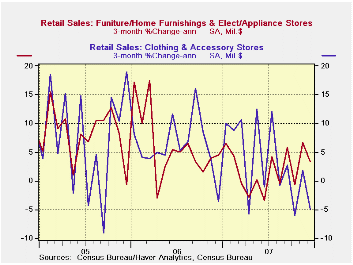
Sales of discretionary items gave back much of their strong November increases. Apparel store sales fell 2.0% (+1.7% y/y) and the prior month was revised down to a 1.6% increase. Furniture, home furnishings & appliance store sales also fell 0.6% (+1.3% y/y) and gave back roughly half of a 1.5% November rise that was taken down slightly. Sales of electronics & appliances fell 1.9% but the prior month's spurt was revised up to 3.3%. Sales at general merchandise stores rose 0.3% (3.8% y/y) and November's gain was unrevised at 0.9%.
Food & beverage store sales which totaled $49.1B rose 0.7% (6.0% y/y). Restaurant & drinking place sales of $38.1B rose 0.2% (2.2% y/y).
During December sales of building materials fell 2.9% (-3.4% y/y). It was the largest decline of four during the last five months.
Sales of nonstore retailers (internet & catalogue) rose 1.0% (12.1% y/y) and the prior month's surge was revised up to 2.1%.
Motor vehicle & parts purchases fell 0.4% (-0.1% y/y). The decline was in line with the 0.4% gain in unit sales of light vehicles last month.
Housing, Credit and Consumer Expenditure from the Federal Reserve Bank of Kansas City can be found here.
| December | November | Y/Y | 2007 | 2006 | 2005 | |
|---|---|---|---|---|---|---|
| Retail Sales & Food Services | -0.4% | 1.0% | 4.1% | 4.1% | 6.2% | 6.6% |
| Excluding Autos | -0.4% | 1.7% | 5.2% | 4.6% | 7.3% | 7.6% |
| Less Gasoline | -0.2% | 0.9% | 3.5% | 4.3 | 7.2% | 6.6% |
by Tom Moeller January 15, 2008
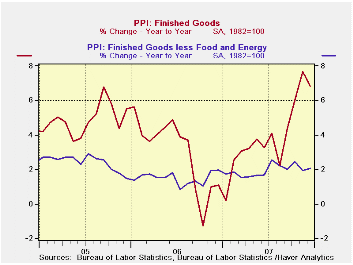
Finished producer prices retreated 0.1% last month after the 3.2% surge during November. The decline compared with an expectation for a 0.2% gain. A 0.2% gain in core producer prices matched expectations.
Energy prices fell 1.9% (+20.4% y/y) after the 14.1% surge in November. Gasoline prices fell 4.8% (+36.8% y/y) following the one-third rise in prices during November. Home heating oil prices were essentially unchanged (30.9% y/y) but that also followed a near one-third November surge. Natural gas prices fell for the third straight month and ticked down 0.1% (-1.3% y/y).
Finished consumer food prices were strong again and rose 1.1%
(7.4% y/y) for the third 1.0%+ gain in the last four months.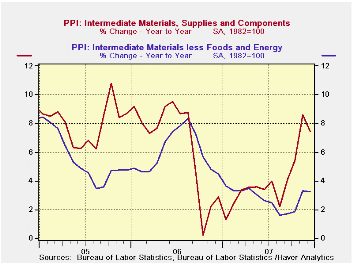
Prices of finished consumer goods (incl. energy) fell 0.1% (+8.4% y/y) after a 4.0% November increase. Capital equipment prices rose 0.1% (1.3% y/y) after the 0.3% November increase. Prices for light trucks fell 0.3% (-0.9% y/y) following the 2.3% November jump.
Intermediate goods prices ticked down 0.2% after the 3.7% November surge as some of the earlier strength in energy prices backpedaled. Excluding food & energy prices were unchanged after the 1.0% November pop.
The gain in the crude materials PPI eased to 1.0% following the 8.7% November surge. Crude energy materials prices fell 0.7% (+17.1% y/y). The core crude materials PPI fell slightly as prices for copper (+1.2% y/y) and aluminum (-5.8% y/y) base scrap fell.
Why Do Gasoline Prices React to Things That Have Not Happened? from the Federal Reserve Bank of St. Louis is available here.
| Producer Price Index | December | November | Y/Y | 2007 | 2006 | 2005 |
|---|---|---|---|---|---|---|
| Finished Goods | -0.1% | 3.2% | 6.8% | 3.9% | 2.9% | 4.9% |
| Core | 0.2% | 0.4% | 2.1% | 1.9% | 1.5% | 2.4% |
| Intermediate Goods | -0.2% | 3.7% | 7.5% | 4.1% | 6.4% | 8.0% |
| Core | 0.0% | 1.0% | 3.3% | 2.8% | 6.0% | 5.5% |
| Crude Goods | 1.0% | 8.7% | 20.3% | 12.2% | 1.4% | 14.6% |
| Core | -0.0% | -0.5% | 16.9% | 15.8% | 20.9% | 4.9% |
by Tom Moeller January 15, 2008
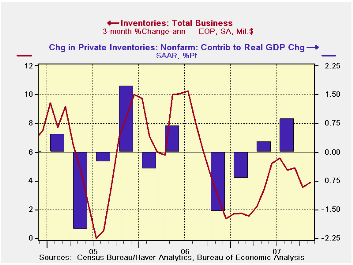
Total business inventory accumulation continued to moderate
and rose 0.4% during November. The three month change in inventories of
3.9 (AR) is less than half the rate of accumulation in mid-2006.
Retail inventories fell 0.1% as inventories excluding autos dropped 0.4% (+2.9% y/y). That y/y rate of accumulation is nearly half the rate last year. Furniture inventories fell 0.5% (+5.5% y/y) and the three month change continued too strong at 12.9% (AR). At clothing & accessory stores inventories fell 0.2% and the three month was quite under control at a manageable -1.7%. Inventories at general merchandise stores also were under control and fell 1.8% in November. Three month growth fell to a negative 4.7%.
Wholesale inventories jumped 0.6% as petroleum inventories surged 2.6% lifting the three month change to 31.9% (AR). During the last ten years there has been a 59% correlation between the annual change in wholesale inventories les petroleum and the change in merchandise imports.
Factory inventories jumped 0.8% and three month growth of 6.2% is well up from being little changed early this year.
| Business Inventories | November | October | Y/Y | 2006 | 2005 | 2004 |
|---|---|---|---|---|---|---|
| Total | 0.4% | 0.1% | 3.5% | 5.9% | 6.2% | 7.9% |
| Retail | -0.1% | 0.3% | 3.4% | 3.2% | 2.8% | 6.8% |
| Retail excl. Autos | -0.4% | 0.6% | 2.9% | 4.5% | 4.5% | 7.2% |
| Wholesale | 0.6% | -0.0% | 4.3% | 8.6% | 7.4% | 9.7% |
| Manufacturing | 0.8% | 0.2% | 2.9% | 6.4% | 8.9% | 7.7% |
by Louise Curley January 15, 2008
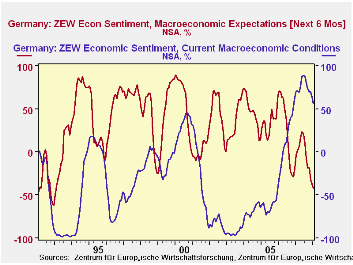
Continued strength of the euro and now fears of recession in
the United States are taking their toll on the confidence of German
institutional investors and financial analysts as shown by the ZEW's
(Center for European Research at Mannheim) Indicator of Economic
Sentiment. The indicator measures the percent difference between those
who expect improvement and those who expect a deterioration in the six
months' outlook and current conditions.
The excess of pessimists over optimists regarding the outlook
for the next six months rose 4.4 points to 41.6% in January from 37.2%
in December and is now at the lowest point since the early nineties.
The excess of optimists over pessimists regarding current conditions
declined 6.9 points to 56.6% from 63.5% in December. This suggests
that, although they are losing confidence in the current conditions,
the financial community still believes that current conditions in
Germany are much better than they have been in some time. The ZEW
indicators for the six months' outlook and current conditions are shown
in the first chart.
In addition to its Indicator of Economic Sentiment, the ZEW
also publishes its participants' profit expectations for the next six
months for selected
industries. These profit expectations give some insight into the
specific concerns underlying the general pessimism of the participants.
In the latest survey, for example, participants expected some of the
biggest declines in profits in the vehicle (automotive), machinery and
chemicals/pharmaceuticals industries--all dependent on overseas demand
that is threatened by the strong euro and consumption and trade,
dependent on the German consumer, whose propensity to consume remains
lackluster. Profit expectations in these industries are shown in the
second chart.
Participants in the January survey apparently expected some
slight improvement in the profits of the depressed financial and
insurance sectors and in the volatile construction industry. The only
industry where profit expectations increased in the month and were
above January 2007 was the service industry. The improvement in profit
expectations in these four industries, shown in the third chart, was
not large enough to offset the deterioration in the profit expectations
in the other industries.
| ZEW (CENTER FOR EUROPEAN ECONOMIC RESEARCH) | Jan 08 | Dec 07 | Jan 07 | M/M %Dif | Y/Y %Dif |
|---|---|---|---|---|---|
| Indicator of Economic Sentiment (% balance) | |||||
| Current Conditions | 56.6 | 63.5 | 70.6 | -6.9 | -14.0 |
| Outlook 6 Months Ahead | -41.6 | -37.2 | -3.6 | -4.4 | -38.0 |
| Profit Expectation 6 Months Ahead | |||||
| Utilities | 29.3 | 22.9 | 7.6 | 6.4 | 21.7 |
| Construction | -17.9 | -20.3 | 32.8 | 2.4 | -50.7 |
| Banking | -56.8 | -61.0 | 38.7 | 4.2 | -95.5 |
| Insurance | -23.2 | -30.8 | 38.1 | 7.6 | -61.3 |
| Vehicles (automotive) | -30.7 | -16.0 | 6.6 | -14.7 | -37.3 |
| Machinery | 26.6 | 33.5 | 57.7 | -6.9 | -30.9 |
| Consumer/Trade | -9.1 | 2.9 | -2.0 | -12.0 | -7.1 |
| Chemical/Pharmaceutical | 17.2 | 20.8 | 33.3 | -3.6 | -16.1 |
by Robert Brusca January 15, 2008
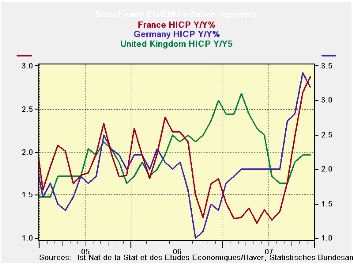
Inflation is above the ECB top allowed mark in seven of nine
early reporters in December, nearly 80% if them. Through November, 92%
of the central 12 members of EMU have inflation running over 2%. That
compares to 80% in October and 50% in September 2007. From September
2006 to September 2007 headline inflation was at or below 2% in most of
these countries. But prior to September 2006 above 2% inflation rates
were more common in Euro Area member countries.
As for Core inflation, in November the core HICP was rising in
9 of 12 key EMU countries (75%). In October the core rate was above 2%
in 66% of these countries and in September 50%. Before that, from
September 2006 through April 2007, that percentage stayed pretty much
at 42% with one tick up in the proportion to 50%.
The Core HICP for EMU did not go up above 2% until recently,
in Sept. 2007. But the headline inflation rate is another story. Since
February 2006, the headline HICP has exceeded 2%; in 19 of those 23
months. The core rate was up in 10 of those 22 months (a December HICP
core is not yet available).
This is why the ECB is nervous. There has been a long run of
the HICP above 2% while the core has only moved up there again,
recently and somewhat sporadically. Core inflation is moving up now
with two of the Big Three EMU economies (Germany and Italy) posting
core rates above 2%. Only France, The Netherlands and Finland have core
inflation persistently holding below the 2% mark.
While there is a debate about how much Europe will slow, and
there is a strong euro in place to help fight inflation, the ECB is
concerned about the structural entrenchment of inflation above 2%.
Above 2% inflation in the core, although the ECB does not exactly say
it that way, has become a problem. Just as inflation has gotten a bit
more worrisome, concerns about growth have escalated as well. This
leaves the ECB in no man’s land. Its response has been to take a harder
rhetorical line against inflation. We’ll see if there is anything more
to it than that in the coming months.
| Euro Area & Friends: Headline Inflation Yr/Yr and trends | |||||||
|---|---|---|---|---|---|---|---|
| Year/year | Mo/Mo | 3-Mo:AR | 6Mo:AR | ||||
| Core HICP | Dec-07 | Nov-07 | Oct-07 | Dec-07 | Nov-07 | Jul-07 | Jun-07 |
| Belgium | 3.1% | 2.9% | 2.2% | 0.5% | 1.0% | 9.1% | 5.1% |
| Finland | 2.0% | 2.2% | 1.9% | -0.1% | 0.6% | 2.7% | 1.6% |
| France | 2.8% | 2.6% | 2.1% | 0.4% | 0.8% | 6.0% | 3.9% |
| Germany | 3.1% | 3.3% | 2.7% | -0.2% | 0.9% | 3.5% | 3.3% |
| Greece | 3.7% | 3.9% | 3.1% | 0.1% | 1.0% | 6.1% | 5.6% |
| Italy | 2.7% | 2.5% | 2.3% | 0.4% | 0.3% | 5.5% | 3.5% |
| Luxembourg | 4.3% | 4.0% | 3.6% | 0.5% | 0.7% | 7.6% | 4.0% |
| The Netherlands | 1.6% | 1.8% | 1.6% | 0.1% | 0.5% | 3.9% | 1.3% |
| Spain | 4.3% | 4.1% | 3.7% | 0.6% | 0.8% | 8.3% | 5.2% |
| EU: Other HICP/CPI | |||||||
| UK (HICP) | 2.1% | 2.1% | 2.0% | 0.3% | 0.4% | 4.7% | 2.1% |

Tom Moeller
AuthorMore in Author Profile »Prior to joining Haver Analytics in 2000, Mr. Moeller worked as the Economist at Chancellor Capital Management from 1985 to 1999. There, he developed comprehensive economic forecasts and interpreted economic data for equity and fixed income portfolio managers. Also at Chancellor, Mr. Moeller worked as an equity analyst and was responsible for researching and rating companies in the economically sensitive automobile and housing industries for investment in Chancellor’s equity portfolio. Prior to joining Chancellor, Mr. Moeller was an Economist at Citibank from 1979 to 1984. He also analyzed pricing behavior in the metals industry for the Council on Wage and Price Stability in Washington, D.C. In 1999, Mr. Moeller received the award for most accurate forecast from the Forecasters' Club of New York. From 1990 to 1992 he was President of the New York Association for Business Economists. Mr. Moeller earned an M.B.A. in Finance from Fordham University, where he graduated in 1987. He holds a Bachelor of Arts in Economics from George Washington University.
More Economy in Brief


