 Global| Nov 14 2008
U.S. Retail Sales Drop With Gasoline Prices, Vehicle & Most Other Sales
by:Tom Moeller
|in:Economy in Brief
Summary
The Commerce Department reported this morning that retail sales dropped 2.8% last month after little revised declines during September and August. The decline exceeded Consensus expectations for a 2.0% drop. Lower vehicle sales, and [...]
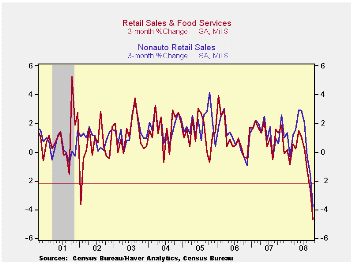
The Commerce Department reported this morning that retail sales dropped 2.8% last month after little revised declines during September and August. The decline exceeded Consensus expectations for a 2.0% drop. Lower vehicle sales, and lower prices for the fuel used to power them, accounted for most of last month's sales' decline. But there was notable weakness elsewhere. The retail sales data are contained in Haver's USECON database.
Motor vehicle & parts sales dropped 5.5% after the
4.8% plunge during September. As a result of these outsized declines,
sales last month were roughly one quarter the year-ago level. The drop
mirrors the 34.2% y/y drop reported last week in unit sales of motor
vehicles.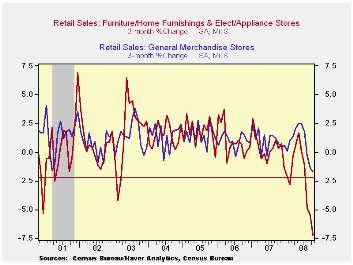
Sales at gasoline service stations dropped 12.7% month-to-month (+0.4% y/y) as gasoline prices fell 17.6% m/m to an average of $3.05 per gallon. Another downward leg is in store for November retail sales given that gasoline prices already have fallen 27% from their October average to $2.22.
Retail sales less autos and gasoline are on a steep downward
trend as well. These sales fell 0.5% which marked the third consecutive
monthly decline. For nonauto sales alone, the 3.8%
three-month decline is the largest in the series' history which extends
back to the 1960s.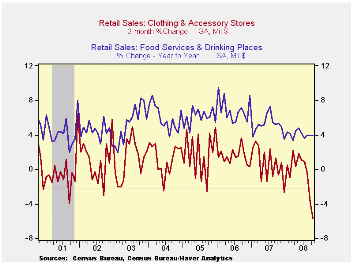
Sales at furniture and electronics & appliance stores fared the worst over the latest three months. They dropped 2.4% during October (-9.7% y/y) and were off 7.2% over the last three months alone. Furniture store sales fell 2.5% during October (-13.5% y/y), for their fourth consecutive monthly drop, and sales of electronics & appliance stores were off by 2.3% (-5.6% y/y). They're down by 6.6% over the last three months.
Apparel store sales hardly did much better, down 1.4% last month (-4.0% y/y) and they were off 5.7% during the last three. Sales at general merchandise stores have done little better. With their 0.4% decline last month (+2.3% y/y) they posted a 1.7% three-month drop.
And people aren't dining out much either. Restaurant & drinking place sales did rise 0.3% last month, but the y/y gain of 3.9% compares to 5.2% growth last year and 6.0%+ growth during the prior three years. They're curtailing spending even as they eat at home. Grocery store sales during the last three months rose just 0.4% after a 4.8% gain during all of last year. Finally, consumers restrained their on-line shopping. Sales of nonstore retailers (mostly electronic shopping) fell 1.8% last month +1.4% y/y) and sales were off 4.2% during the last three months.
Sales of building materials and garden equipment fell 0.4% (-1.5% y/y), their fourth down month in the last five.
| October | September | August | Y/Y | 2007 | 2006 | 2005 | |
|---|---|---|---|---|---|---|---|
| Retail Sales & Food Services (%) | -2.8 | -1.3 | -0.7 | -4.1 | 4.1 | 5.8 | 6.4 |
| Excluding Autos | -2.2 | -0.5 | -1.1 | 1.0 | 4.5 | 6.8 | 7.5 |
| Less Gasoline | -0.5 | -0.6 | -0.8 | 1.0 | 4.1 | 6.2 | 6.4 |
by Tom Moeller November 14, 2008
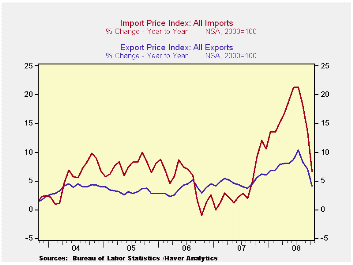
Total U.S. import prices fell another 4.7% last month following the little-revised 3.3% September drop. Consensus expectations had been for a 4.4% drop during October.
Petroleum prices cratered another 16.7% and this month imported crude petroleum prices are down another 19% m/m.
During October import prices less petroleum fell 0.9%, the same as during September. During the last three months prices fell at an 8.4% annual rate versus the 12 to 13% rates of positive growth this past spring.
Growth
in import prices will slow further given the recent rise in the foreign
exchange value of the dollar. During
the last ten years there has been a 66% (negative) correlation between
the nominal trade-weighted exchange value of the US dollar vs. major
currencies and the y/y change in non oil import prices. The correlation
is a reduced 47% against a broader basket of currencies.
Capital goods import prices fell 0.2% after two months of no change. On a three-month basis prices fell at a 0.9% annual rate after a 5% to 6% rate of increase earlier this year. Less the lower prices of computers, capital goods prices ticked 0.1% lower but three month growth was just 1.1% after 9% growth earlier this year. Prices of computers, peripherals & accessories were down at a 6.8% rate during the last three months.
Finally, prices for nonauto consumer goods ticked up 0.1% and the 0.4% rate of increase during the last three months is down from the 5.9% peak earlier this year. Durable goods prices overall rose at a 1.2% rate during the last three months versus a 6.2% rate of increase earlier this year.
Total export prices fell another 1.9% due to an 8.7% (+5.7% y/y) decline in agricultural prices which followed a 0.1% September uptick. Nonagricultural export prices slumped another 1.2% (+4.0% y/y), the third consecutive monthly decline.
| Import/Export Prices (NSA, %) | October | September | Y/Y | 2007 | 2006 | 2005 |
|---|---|---|---|---|---|---|
| Import - All Commodities | -4.7 | -3.3 | 6.7 | 4.2 | 4.9 | 7.5 |
| Petroleum | -16.7 | -10.2 | 13.1 | 11.6 | 20.6 | 37.6 |
| Non-petroleum | -0.9 | -0.9 | 5.0 | 2.7 | 1.7 | 2.7 |
| Export- All Commodities | -1.9 | -0.8 | 4.2 | 4.9 | 3.6 | 3.2 |
by Tom Moeller November 14, 2008
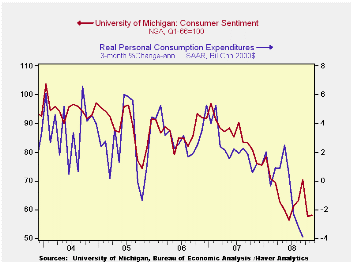
The University of Michigan's reading of consumer sentiment for the middle of this month remained near the low posted during October. The index ticked up to 57.9 from 57.6. The latest level was near the lowest for the series since this past June which in turn was the lowest since early-1980. The latest figure was higher than Consensus expectations for a reading of 56.0.
During the last ten years there has been a 55% correlation between the level of sentiment and the three-month change in real consumer spending.
The mid-month current conditions index improved modestly to
61.4 but it remained down by one-third from last year. The view of
current personal finances ticked up m/m but remained down by more than
one-third from last year. The index of buying conditions for large
household goods recouped about one-third of the October decline but
remained off 30.9% y/y and near the lowest since 1980.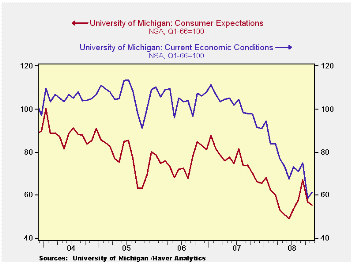
The expectations component of consumer sentiment was down. A 2.3% m/m decline this month came on top of the 15.2% October drop. The figures were, however, slightly above the lows reached this past Spring. Expectations for business conditions during the next years fell slightly as did expectations for conditions during the next year, but they both remained up from their recent lows. The expected change in personal finances ticked higher by 0.9% m/m and the reading was up 10% from the Spring low.
The opinion of government policy, which apparently influences economic expectations, also ticked up from October (-35.4% y/y). Only a slightly improved seven percent of respondents thought that a good job was being done by government while 54% thought a poor job was being done. That was near the highest percentage on record.
Recent economic weakness and lower oil prices caused inflation expectations to fall. The mean expected rate of inflation during the next year plummeted to 2.9% from 4.3% last month. It was as high as 7.0% in May. The expected inflation rate during the next five years ticked up to 3.3%, near the lowest level since 2003.
The University of Michigan survey is not seasonally adjusted.The reading is based on telephone interviews with about 500 households at month-end; the mid-month results are based on about 300 interviews. The summary indexes are in Haver's USECON database, with details in the proprietary UMSCA database.
| University of Michigan | Mid-November | October | September | November y/y | 2007 | 2006 | 2005 |
|---|---|---|---|---|---|---|---|
| Consumer Sentiment | 57.9 | 57.6 | 70.3 | -23.9% | 85.6 | 87.3 | 88.5 |
| Current Conditions | 61.4 | 58.4 | 75.0 | -32.9 | 101.2 | 105.1 | 105.9 |
| Expectations | 55.7 | 57.0 | 67.2 | -15.9 | 75.6 | 75.9 | 77.4 |
by Tom Moeller November 14, 2008
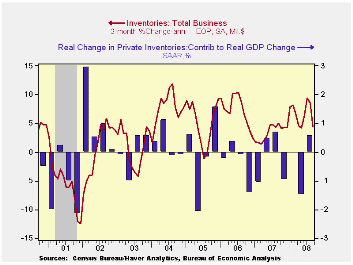
During September, total business inventories reversed all of their August rise and fell 0.2%. The decline was weaker than Consensus expectations for no change. More importantly, however, it could suggest that the addition to 3Q GDP growth of 0.6 percentage points from faster inventory accumulation waned as the quarter progressed. As of September the three-month growth in inventories fell to 4.4% (AR) from roughly 6.5% during the prior two quarters.
Normally, the suggestion of less of a contribution would be a sure thing. But these are not normal times given the drop in oil prices. Lower oil prices have dramatically reduced the value of inventories held by retailers, wholesalers and manufacturers.
Retail inventories rose 0.2% in September after a 0.7% August decline. The three-month growth rate of retail inventories picked up to 3.4% from 0.1% during 2Q. Accumulation of automobiles accounted for that increase rising at a 3.5% rate last quarter versus a decline of 5.7% during 2Q. Outside of autos, retail inventories rose 0.4% during September after a 0.2% August decline. The 3.3 rate of accumulation last quarter was roughly the same as during 2Q.
The industry detail in the retail sector indicated that higher
apparel inventories contributed with a 3.1% rise last quarter versus
0.2% decumulation during 2Q. Furniture inventories rose at a 7.4% rate
last quarter, about the same as during 2Q, and general merchandise
inventories showed virtually zero growth after a 2.0% gain during 2Q.
The fastest rate of accumulation came from building materials which ran
up last quarter at a 13.1% rate after slight 2Q decumulation.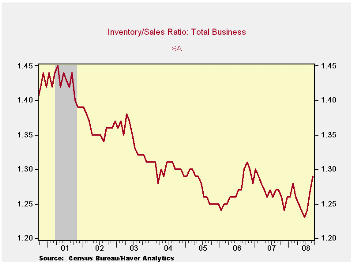
Factory inventories declined 0.7% during September and the three-month rate of accumulation fell sharply to 2.2% from a 7.4% rate during 2Q.
Wholesale inventories slipped 0.1%, largely reflecting a 3.5% decline in petroleum inventories. For the quarter wholesale inventories rose at an 8.6% rate after a 13.4% 2Q increase.
Total business sales fell 2.0% during September, about as they did in August, led lower by the drop in oil prices.
Today's speech by Fed President Ben S. Bernanke titled Policy Coordination Among Central Banks can be found here.
| Business Inventories | September | August | Y/Y | 2007 | 2006 | 2005 |
|---|---|---|---|---|---|---|
| Total | -0.2% | 0.2% | 5.5% | 3.8% | 5.9% | 6.0% |
| Retail | 0.2% | -0.7% | 0.5% | 2.6% | 3.5% | 2.3% |
| Retail excl. Auto | 0.4% | -0.2% | 2.2% | 2.7% | 4.9% | 3.9% |
| Wholesale | -0.1% | 0.6% | 9.7% | 5.5% | 8.3% | 7.3% |
| Manufacturing | -0.7% | 0.7% | 7.0% | 3.7% | 6.4% | 8.9% |
by Robert Brusca November 14, 2008
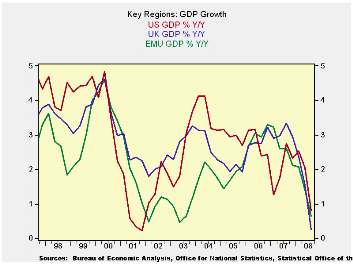
The decline in US, UK and EMU GDP growth is all occurring at
once. Yr/Yr GDP growth is in a slowing down mode with the slowing at a
rather severe pace. We can see that the degree of slowdown and the low
pace of growth are both comparable to the decelerations in 2000-2001.
At that time the decelerating came from a higher pace of growth to
start with.
While the US is being made the ‘poster boy of the downturn’ in
terms of being the cause of this recession, the data show us that the
persisting sharp slowing in growth began in EMU as its currency rose
above level that growth in that region could tolerate.. The decline in
the UK growth rate came later and has been synchronous with the decline
in the US growth but UK growth has fallen harder- from a higher initial
pace.
The US suffered worse in the earlier cycle, around the year
2000, as its growth dropped from an above European pace to a below
European pace at the trough. But the US economy subsequently had a
recovery phase that was quite robust pushing US growth above the growth
rates in EMU and the UK from 2003 – 2006. Then US growth began to get
erratic. But the ongoing cyclical weakness in the US did not start
again until nearly four quarters after EMU’s GDP began to make its
ongoing turn for the worse at the of 2006. EMU Yr/Yr growth peaked late
in 2006 at 3.3% and has since then been steadily eroding.
Right now the UK, EMU and the US (Japan, and many others, too)
are engulfed n a synchronous downturn. And it has begun to create
tensions.
In the US, the automakers are in trouble as unit auto sales
slipped to just above a 10mu unit rate last month an extremely low pace
that implies crushing overhead costs from fixed business charges. .
With a huge number of jobs linked to the auto sector, the US is
concerned that GM, Ford and Chrysler are in such straights. And with a
bailout plan that has been used to help financial firms there is now a
clamoring in the US to help the auto makers. But in Europe auto sales
are weak too; there sales have fallen for six months running. The
European Commission warned it would contest any U.S. bailout for the
sector that broke state aid rules. Insurers in Europe have withdrawn
credit protection for auto suppliers that protected them in the event
of bankruptcies of the US auto makers. Asian and European automakers
are feeling the pinch but still are not in the desperate circumstances
that US car makers face.
The EU Threat
"We are in the process of analyzing the <US>
plan. The plan has not yet been presented yet. Of course, if it is
illegal state aid, we will act at a WTO level," Commission President
Jose Manuel Barroso has said. So the lines are drawn. The risk is
protectionism and its ability to create a deep downward spiral since it
is hard to imagine that the US would let a European protest stand in
the way of supporting the automakers. And if the US did that the
Europeans surely would gain some WTO sanctioned recourse to retaliate
and that is how the mess gets out of hand.
So yes, economies are weak. Financial sectors are strained.
Central banks are cutting rates. There have been some assistance plans.
In the US where import penetration is the most freely allowed, the US
automakers are feeling the pinch. As US lawmakers argue about remedies
for the ‘Big Three’ European’s plan a surprise attack of their own
through WTO. If you think the only risk here is the economic downturn
and the financial sector, you are fooling yourself.
| Euro-Area and main G-10 country GDP Results | |||||||
|---|---|---|---|---|---|---|---|
| Quarter over quarter-Saar | Year/Year | ||||||
| GDP | Q3-08 | Q2-08 | Q1-08 | Q3-08 | Q2-08 | Q1-08 | Q4-07 |
| EMU-15 | -0.8% | -0.7% | 2.7% | 0.7% | 1.4% | 2.1% | 2.1% |
| France | 0.6% | -1.1% | 1.6% | 0.6% | 1.2% | 2.0% | 2.2% |
| Germany | -2.1% | -1.7% | 5.7% | 0.8% | 1.9% | 2.7% | 1.7% |
| Italy | -2.0% | -1.8% | 2.1% | -0.9% | -0.2% | 0.4% | 0.1% |
| The Netherlands | 0.1% | 0.0% | 1.3% | 1.6% | 2.9% | 3.7% | 4.1% |
| UK | -2.1% | 0.0% | 1.1% | 0.3% | 1.5% | 2.4% | 2.9% |
| US | -0.3% | 2.8% | 0.9% | 0.8% | 2.1% | 2.5% | 2.3% |

Tom Moeller
AuthorMore in Author Profile »Prior to joining Haver Analytics in 2000, Mr. Moeller worked as the Economist at Chancellor Capital Management from 1985 to 1999. There, he developed comprehensive economic forecasts and interpreted economic data for equity and fixed income portfolio managers. Also at Chancellor, Mr. Moeller worked as an equity analyst and was responsible for researching and rating companies in the economically sensitive automobile and housing industries for investment in Chancellor’s equity portfolio. Prior to joining Chancellor, Mr. Moeller was an Economist at Citibank from 1979 to 1984. He also analyzed pricing behavior in the metals industry for the Council on Wage and Price Stability in Washington, D.C. In 1999, Mr. Moeller received the award for most accurate forecast from the Forecasters' Club of New York. From 1990 to 1992 he was President of the New York Association for Business Economists. Mr. Moeller earned an M.B.A. in Finance from Fordham University, where he graduated in 1987. He holds a Bachelor of Arts in Economics from George Washington University.
More Economy in Brief


