 Global| Jan 15 2004
U.S. Retail Sales Disappoint
by:Tom Moeller
|in:Economy in Brief
Summary
Retail sales rose 0.5% last month, somewhat less than the 0.8% Consensus expectation. The previously reported 0.9% gain in November sales was revised up to a 1.2% increase. Sales of nonstore retailers surged 2.1% (9.1% y/y). Motor [...]
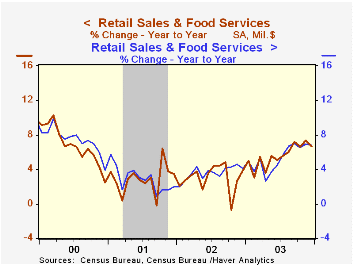
Retail sales rose 0.5% last month, somewhat less than the 0.8% Consensus expectation. The previously reported 0.9% gain in November sales was revised up to a 1.2% increase.
Sales of nonstore retailers surged 2.1% (9.1% y/y).
Motor vehicle dealers' sales rose 1.6% m/m. Unit sales of light vehicles rose 6.9% m/m to 17.9M. Sales at gasoline service stations fell 0.4% (4.8% y/y).
Excluding motor vehicles & parts dealers retail sales rose 0.1% last month but the previously reported 0.4% November increase was nearly doubled to 0.7%. Consensus expectations were for a 0.4% rise December rise.
Clothing and accessory store sales rose 0.1% (5.3% y/y) following a 1.0% November gain. Sales of furniture/home furnishings & electronics/appliances rose 0.2% (9.3% y/y) but the previously reported 1.0% November jump was revised to 0.6%. Sales at general merchandise stores rose 0.3% (5.4% y/y).
Sales of building materials fell 0.3% (11.9% y/y) following a 0.4% November gain.
Sales at food services & drinking places rose 0.4% (8.9% y/y) but the previously reported 0.3% November gain was revised to 1.2%.
A report from the Federal Reserve Bank of New York titled "A Nation of Spendthrifts? An Analysis of Trends in Personal and Gross Saving" from 2000 is available here.
| Dec | Nov | Y/Y | 2003 | 2002 | 2001 | |
|---|---|---|---|---|---|---|
| Retail Sales & Food Services | 0.5% | 1.2% | 6.7% | 5.6% | 3.0% | 2.9% |
| Excluding Autos | 0.1% | 0.7% | 6.7% | 5.4% | 3.6% | 2.9% |
by Tom Moeller January 15, 2004
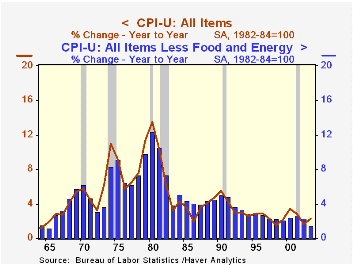
The Consumer Price Index (CPI-U) rose an expected 0.2% (+1.9% y/y) in December, reversing the deflation of the prior month.
Less food & energy prices rose an expected 0.1% and reversed the prior month's decline. The full-year increase in core prices of 1.5% was the weakest gain since 1965.
Deflation in the prices of core consumer goods continued and they fell 0.1% (-2.5% y/y). Apparel prices fell 0.4% (-2.0% y/y). New & used motor vehicle prices fell 0.4% (-4.4% y/y). Prices for household furnishings & operation ticked up 0.2% (-1.8% y/y).
Core services prices edged up 0.2% on the strength of a 0.3% (2.2% y/y) gain in shelter prices. Medical care services prices also were strong, up 0.6% m/m (4.2% y/y). Public transportation prices fell 1.1% for the fourth down month in the last five (1.3% y/y).
Food prices again were firm again, up 0.6% (3.6%). Meat prices jumped another 1.1% (11.5% y/y).
Energy prices rose a modest 0.2% as piped gas prices rose for the first month in three (+6.6% y/y). Gasoline prices fell for the third straight month (+6.8% y/y) and fuel oil prices also fell (9.1% y/y).
The chained CPI which adjusts for shifts in consumer buying behavior fell 0.2% for the second monthly decline. It is similar to the PCE price deflator. The core price measure also fell for the second month. For the year the measure rose 1.0%.
| Consumer Price Index | Dec | Nov | Y/Y | 2003 | 2002 | 2001 |
|---|---|---|---|---|---|---|
| Total | 0.2% | -0.2% | 1.9% | 2.3% | 1.6% | 2.8% |
| Total less Food & Energy | 0.1% | -0.1% | 1.1% | 1.5% | 2.3% | 2.7% |
| Goods less Food & Energy | -0.1% | -0.4% | -2.5% | -2.0% | -1.1% | 0.3% |
| Services less Energy | 0.2% | 0.0% | 2.6% | 2.9% | 3.8% | 3.7% |
| Energy | 0.2% | -3.0% | 6.7% | 12.2% | -5.8% | 3.7% |
| Food & Beverages | 0.6% | 0.4% | 3.6% | 2.1% | 1.8% | 3.1% |
| Chained CPI: Total (NSA) | -0.2% | -0.4% | 1.4% | 1.8% | 1.3% | 2.3% |
| Total less Food & Energy | -0.3% | -0.3% | 0.6% | 1.0% | 1.8% | 2.0% |
by Tom Moeller January 15, 2004
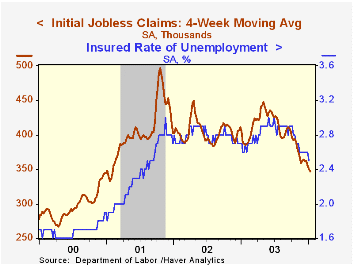
Initial claims for jobless insurance fell 11,000 last week to 343,000 and reversed virtually all of the prior week's rise which was little revised. Consensus expectations had been for claims of 350,000.
The four-week moving average of initial claims fell to 347,500 (-10.7% y/y).
Continuing claims for unemployment insurance fell 128,000 and the prior week's decline was about doubled to 27,000.
The insured rate of unemployment fell to 2.5%, the lowest level since September 2001.
Analysis from the Federal Reserve Bank of Boston on the Philips Curve is available here.
| Unemployment Insurance (000s) | 01/10/04 | 01/03/04 | Y/Y | 2003 | 2002 | 2001 |
|---|---|---|---|---|---|---|
| Initial Claims | 343.0 | 354.0 | -6.8% | 403 | 404 | 406 |
| Continuing Claims | -- | 3,139 | -7.0% | 3,535 | 3,575 | 3,022 |
by Tom Moeller January 15, 2004
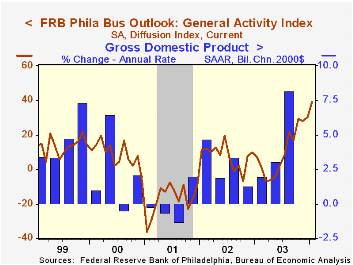
The Philadelphia Fed’s January index of general business conditions in the manufacturing sector rose to 38.8 from 30.3 in December. Consensus expectations were for an unchanged reading at 30.0.
The latest reading is the highest since December 1993.
During the last twenty years there has been a 62% correlation between the level of the Philadelphia Fed Business Conditions Index and quarterly growth in real GDP. The correlation with quarterly growth in factory sector industrial production has been 76%.
Amongst the sub indexes, new orders dipped slightly to 36.5 from a revised 37.9 in December. Shipments fell to 33.1 from a downwardly revised 39.6 in December. The employment index held a firm level with only a slight dip to 17.5.
The business conditions index reflects a separate survey question, not the sub indexes.
A separate survey of expected business conditions in six months fell to 53.9, the lowest level since June.
The prices paid index surged to the highest level since February 2000.
The Philadelphia Fed index is based on a survey of 250 regional manufacturing firms, but these firms sell nationally and internationally.
The latest Business Outlook survey from the Philadelphia Federal Reserve Bank can be found here.
| Philadelphia Fed Business Outlook | Jan | Dec | Jan '03 | 2003 | 2002 | 2001 |
|---|---|---|---|---|---|---|
| General Activity Index | 38.8 | 30.3 | 7.2 | 10.6 | 7.7 | -17.2 |
| Prices Paid Index | 35.3 | 30.9 | 14.5 | 16.7 | 12.2 | -0.9 |
by Tom Moeller January 15, 2004

The Small Business Optimism Index for December published by the National Federation of Independent Business rose 1.5% m/m to 106.9, a near record level.
The increase reflected a surge to 20% in the percent of small business owners planning to increase employment. Capital spending plans were raised by 38% of respondents, the highest since early 2001.
The percent of owners raising average selling prices dipped to 6% versus a high of 8% in October.
About 24 million businesses exist in the United States. Small business creates 80% of all new jobs in America.
| Nat'l Federation of Independent Business | Dec | Nov | Y/Y | 2003 | 2002 | 2001 |
|---|---|---|---|---|---|---|
| Small Business Optimism Index (1986=100) | 106.9 | 105.3 | 8.5% | 101.3 | 101.2 | 98.4 |

Tom Moeller
AuthorMore in Author Profile »Prior to joining Haver Analytics in 2000, Mr. Moeller worked as the Economist at Chancellor Capital Management from 1985 to 1999. There, he developed comprehensive economic forecasts and interpreted economic data for equity and fixed income portfolio managers. Also at Chancellor, Mr. Moeller worked as an equity analyst and was responsible for researching and rating companies in the economically sensitive automobile and housing industries for investment in Chancellor’s equity portfolio. Prior to joining Chancellor, Mr. Moeller was an Economist at Citibank from 1979 to 1984. He also analyzed pricing behavior in the metals industry for the Council on Wage and Price Stability in Washington, D.C. In 1999, Mr. Moeller received the award for most accurate forecast from the Forecasters' Club of New York. From 1990 to 1992 he was President of the New York Association for Business Economists. Mr. Moeller earned an M.B.A. in Finance from Fordham University, where he graduated in 1987. He holds a Bachelor of Arts in Economics from George Washington University.
More Economy in Brief


