 Global| Aug 13 2008
U.S. Retail Sales Dipped As Expected, Internet & Catalogue Sales Jumped
by:Tom Moeller
|in:Economy in Brief
Summary
U.S. retail sales last month dipped 0.1%, right on Consensus expectations. The decline followed an upwardly revised June rise of 0.3%. On a three-month basis overall retail sales rose at a 4.1% annual rate, even with last year's 4.0% [...]
U.S. retail sales last month dipped 0.1%, right on Consensus expectations. The decline followed an upwardly revised June rise of 0.3%. On a three-month basis overall retail sales rose at a 4.1% annual rate, even with last year's 4.0% increase.
The overall gain was diminished by another sharp decline in sales of motor vehicles & parts. A 2.4% drop (-10.5% y/y) followed the 2.1% June decline (revised shallower) and they are down at a 19.7% annual rate during the last three months.
Retail sales excluding autos rose 0.4% in July. That increase about equaled Consensus expectations.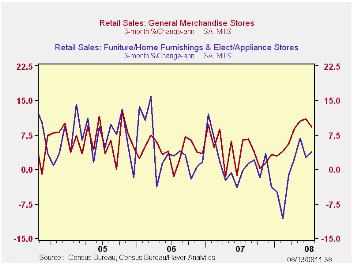
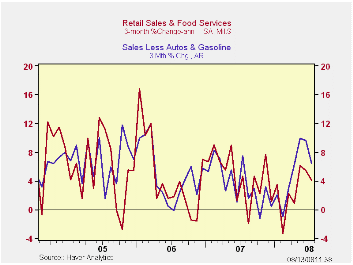
Less gasoline & autos, retail sales rose 0.3% (3.4% y/y) following an upwardly revised 0.4% increase during June. Still, the latest increase was the weakest since February. Sales on a three-month basis rose at a firm 6.4% annual rate.
Purchases made from home continued strong as July sales of nonstore retailers (internet & catalogue) jumped 1.1% (7.7% y/y). That followed an unrevised 0.8% June increase. On a three-month basis these sales rose at a 12.4% annual rate.
Sales at general merchandise stores rose 0.3% (5.2% y/y) following an upwardly revised 0.6% gain during June. Sales offurniture, home furnishings & appliance reversed the June decline and rose 0.9% (-0.2% y/y). Sales of furniture & home furnishings rose 1.0% (-4.8% y/y). Apparel store sales ticked up 0.2% (0.9% y/y).
Building materials & garden equipment sales reversed their June decline and rose 0.3% (-1.0% y/y).
Unanchored Expectations? Interpreting the Evidence from Inflation Surveys from the Federal Reserve Bank of San Francisco is available here.
| July | June | Y/Y | 2007 | 2006 | 2005 | |
|---|---|---|---|---|---|---|
| Retail Sales & Food Services | -0.1% | 0.3% | 2.6% | 4.0% | 5.8% | 6.4% |
| Excluding Autos | 0.4% | 0.9% | 6.0% | 4.5% | 6.8% | 7.5% |
| Less Gasoline | 0.3% | 0.4% | 3.4% | 4.1% | 6.2% | 6.4% |

Tom Moeller
AuthorMore in Author Profile »Prior to joining Haver Analytics in 2000, Mr. Moeller worked as the Economist at Chancellor Capital Management from 1985 to 1999. There, he developed comprehensive economic forecasts and interpreted economic data for equity and fixed income portfolio managers. Also at Chancellor, Mr. Moeller worked as an equity analyst and was responsible for researching and rating companies in the economically sensitive automobile and housing industries for investment in Chancellor’s equity portfolio. Prior to joining Chancellor, Mr. Moeller was an Economist at Citibank from 1979 to 1984. He also analyzed pricing behavior in the metals industry for the Council on Wage and Price Stability in Washington, D.C. In 1999, Mr. Moeller received the award for most accurate forecast from the Forecasters' Club of New York. From 1990 to 1992 he was President of the New York Association for Business Economists. Mr. Moeller earned an M.B.A. in Finance from Fordham University, where he graduated in 1987. He holds a Bachelor of Arts in Economics from George Washington University.
More Economy in Brief


