 Global| May 13 2009
U.S. Retail Sales Decline For A Second Month
by:Tom Moeller
|in:Economy in Brief
Summary
U.S. retail sales continued to struggle last month following the recovery earlier this year. In fact, virtually all of that recovery has been erased by the latest declines. April retail sales declined by 0.4% following their 1.3% [...]
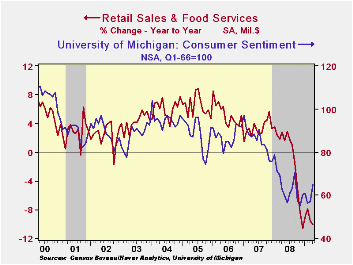
U.S. retail sales continued to struggle last month following the recovery earlier this year. In fact, virtually all of that recovery has been erased by the latest declines. April retail sales declined by 0.4% following their 1.3% March drop. Moreover, sales both during March and back to 2007 were revised lower with benchmark changes to the data series. The latest decline in retail sales fell short of expectations for no change month-to-month. The retail sales data are available in Haver's USECON database.
Unlike prior months, motor vehicle sales were not so much
responsible for the decline in overall consumer purchases. Vehicle
sales rose 0.2% following two months of sharp decline. However, the
increase contrasted with the earlier report that unit vehicle sales
fell 5.5% in April. Also contradictory was a 2.3% decline in gasoline
service station sales despite a 4.6% m/m rise in gasoline prices.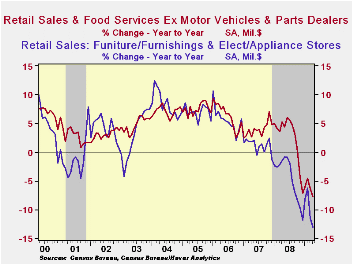
Elsewhere the news in last month's retail sales report was weak as discretionary spending was pulled back. Sales at furniture, electronics & appliance stores fell another 1.7% (-13.1% y/y) following the 5.2% drop during March which was deeper than reported initially. Furniture store sales alone ticked down 0.5% (-14.2% y/y) while sales of electronics & appliances again fell sharply. The 2.8% April drop (-12.0% y/y) followed a 7.8% March decline.
In the soft goods area apparel store sales slipped by 0.5% (-6.5% y/y) after a 2.9% March decline. Sales at general merchandise stores also staggered and slipped 0.1%. They are virtually unchanged over the last twelve months.
And internet purchases continued lower. Sales at non-store retailers slipped 0.1% (-7.8% y/y) after a 1.2% March drop. Restaurant sales also have been weak but they did rise 0.2% (1.4% y/y).
Building materials sales squeaked out a 0.2% increase last month but they still are down by 10.7% from last April.
Supply Shocks, Demand Shocks, and Labor Market Fluctuations from the Federal Reserve Bank of St. Louis is available here.
| April | March | February | Y/Y | 2008 | 2007 | 2006 | |
|---|---|---|---|---|---|---|---|
| Retail Sales & Food Services (%) | -0.4 | -1.3 | 0.4 | -10.1 | -0.7 | 3.3 | 5.3 |
| Excluding Autos | -0.5 | -1.2 | 1.1 | -7.7 | 2.5 | 3.9 | 6.3 |
| Less Gasoline | -0.3 | -1.0 | 0.8 | -3.1 | 1.6 | 3.6 | 5.7 |
by Robert Brusca May 13, 2009
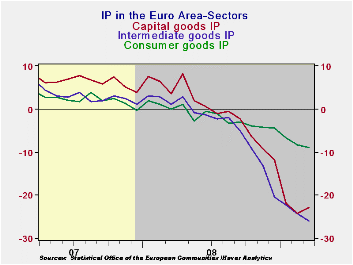
Euro Area manufacturing output fell by 2.1% in March. The
21.2% drop Yr/Yr exceeds the 20.2% drop posted in February. The
sequential growth rate rates seem to have stabilized at a very torrid
pace of decline just under 30% at an annual rate. The capital goods
sector shows some slowdown in its decline in the Year/Year numbers but
the 3-mo growth rates for capital goods continue to deteriorate beyond
their readings for the six month growth rate.
Germany, Italy and Spain have the most rapid declines in IP
growth over the past three months. Germany and Italy are also the two
worst over the last 12-months. Output declines in the UK have slowed
markedly in the last few months; they post an annual rate of decline of
only -12.9% over three months.
For the quarter, massive declines in output are still being
registered. In Germany output is declining in the quarter at a 45%
annual rate. In France the decline is at a 25% annual rate. In Italy it
falls at a 34% annual rate. UK IP is falling at a 20% annual rate in
the quarter despite its recent greater stability. The upcoming EU
member country GDP growth rates for Q1 should be extremely weak
| Euro Area MFG IP | ||||||||||
|---|---|---|---|---|---|---|---|---|---|---|
| Saar except m/m | Mo/Mo | Mar 09 |
Feb 09 |
Mar 09 |
Feb 09 |
Mar 09 |
Feb 09 |
|||
| Euro Area Detail | Mar 09 |
Feb 09 |
Jan 09 |
3Mo | 3Mo | 6mo | 6mo | 12mo | 12mo | Q-1 |
| MFG | -2.1% | -2.4% | -3.6% | -28.1% | -31.9% | -29.0% | -29.5% | -21.2% | -20.2% | -31.2% |
| Consumer | -1.3% | -1.7% | -1.0% | -14.9% | -12.0% | -11.1% | -10.4% | -9.0% | -8.2% | -12.0% |
| Consumer Durables | -2.5% | -3.6% | -2.4% | -29.4% | -29.9% | -28.9% | -29.1% | -22.2% | -21.3% | -- |
| Consumer Non-durables | -1.0% | -1.5% | -0.9% | -12.6% | -9.8% | -8.1% | -7.5% | -6.8% | -6.4% | -- |
| Intermediate | -3.1% | -2.5% | -1.6% | -25.3% | -35.5% | -35.2% | -35.8% | -26.0% | -24.3% | -34.0% |
| Capital | -0.5% | -2.9% | -7.2% | -35.6% | -41.6% | -33.1% | -36.2% | -22.8% | -24.2% | -40.0% |
| Main Euro Area Countries and UK IP in MFG | ||||||||||
| Mo/Mo | Mar09 | Feb09 | Mar09 | Feb09 | Mar09 | Feb09 | ||||
| MFG Only | Mar 09 |
Feb 09 |
Jan 09 |
3Mo | 3Mo | 6mo | 6mo | 12mo | 12mo | Q-1- Date |
| Germany: | -0.2% | -3.5% | -7.7% | -37.8% | -48.4% | -37.1% | -40.0% | -22.9% | -22.9% | -45.7% |
| France: IP ex Construction | -1.4% | -0.9% | -3.9% | -22.2% | -23.0% | -25.1% | -25.5% | -16.1% | -15.9% | -24.7% |
| Italy | -4.7% | -5.0% | -1.3% | -36.4% | -35.7% | -34.8% | -33.7% | -25.6% | -21.6% | -34.1% |
| Spain | -5.1% | 1.1% | -8.2% | -39.7% | -21.4% | -36.5% | -25.5% | -13.9% | -24.5% | -37.1% |
| UK: EU member | 0.0% | -0.3% | -3.1% | -12.9% | -19.3% | -18.0% | -19.7% | -12.9% | -13.4% | -20.3% |
by Tom Moeller May 13, 2009
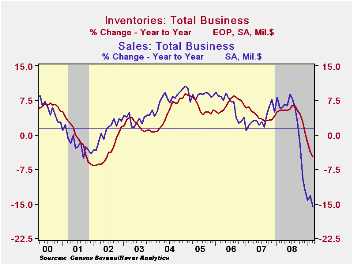
Total business inventories fell another 1.0% during March,
down for the seventh straight month. These declines have given rise to
a three-month decumulation rate of 13.5%. That is the strongest in the
series' history which dates back to 1980. The recent cutback in
inventory accumulation is in reaction to an 11.0% rate of decline in
business sales. However, the strong inventory cutbacks have done little
to reduce the inventory/sales ratio which, at 1.44, was at its highest
level since the recession of 2001. Illustrating the degree of inventory
back-up is the increase in the I/S ratio during the last year, which is
the swiftest since 1982. The rise ended a twenty-eight year downtrend.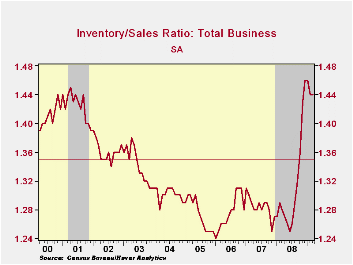
Retailers cut inventories by 0.7% in March and at a 13.2% annual rate during the last three months, nearly the fastest in the series' history. Motor vehicle inventories continued to lead the decumulation and fell at a 30.1% rate during the last three months. Nevertheless, the inventory-to-sales ratio for automobiles remained near its historic high at 2.59. So unless sales recover soon, expect further production cuts.
Outside of autos, retailers continued to reduce the levels of unwanted products. Furniture, home furnishings & electronics inventories fell 0.5% in March and they are off 8.6% during the past year. Apparel retailers ratcheted up the speed of cutbacks with a 1.4% March drawdown. Over the last three months they're down at a 9.7% annual rate, nearly the swiftest on record. General merchandise inventories bucked the trend, however, and rose 0.8% in March but they're still off at a 4.8% rate during the last three months. Despite the cuts the inventory-to-sales ratio for the nonauto retail sector remained high.
The business sales and inventory data are available in Haver's USECON database.
Inventory Accelerator In General Equilibrium from the Federal Reserve Bank of St. Louis can be found here.
| Business Inventories (%) | March | February | January | Y/Y | 2008 | 2007 | 2006 |
|---|---|---|---|---|---|---|---|
| Total | -1.0 | -1.4 | -1.2 | -4.8 | 0.6 | 4.0 | 6.4 |
| Retail | -0.7 | -1.2 | -1.6 | -6.9 | -3.1 | 2.5 | 3.3 |
| Retail excl. Auto | -0.2 | -0.5 | -0.6 | -3.1 | -1.8 | 2.7 | 4.7 |
| Wholesale | -1.6 | -1.7 | -0.9 | -3.5 | 3.1 | 6.2 | 8.2 |
| Manufacturing | -0.8 | -1.3 | -1.1 | -3.8 | 2.1 | 3.7 | 8.2 |

Tom Moeller
AuthorMore in Author Profile »Prior to joining Haver Analytics in 2000, Mr. Moeller worked as the Economist at Chancellor Capital Management from 1985 to 1999. There, he developed comprehensive economic forecasts and interpreted economic data for equity and fixed income portfolio managers. Also at Chancellor, Mr. Moeller worked as an equity analyst and was responsible for researching and rating companies in the economically sensitive automobile and housing industries for investment in Chancellor’s equity portfolio. Prior to joining Chancellor, Mr. Moeller was an Economist at Citibank from 1979 to 1984. He also analyzed pricing behavior in the metals industry for the Council on Wage and Price Stability in Washington, D.C. In 1999, Mr. Moeller received the award for most accurate forecast from the Forecasters' Club of New York. From 1990 to 1992 he was President of the New York Association for Business Economists. Mr. Moeller earned an M.B.A. in Finance from Fordham University, where he graduated in 1987. He holds a Bachelor of Arts in Economics from George Washington University.
More Economy in Brief


