 Global| Feb 13 2008
U.S. Retail Sales Above Expectations: Auto Sales & Gas Prices Rose
by:Tom Moeller
|in:Economy in Brief
Summary
U.S. retail sales rose 0.3% during January following an unrevised 0.4% decline during December. The gain beat expectations for a 0.2% decline. Motor vehicle & parts purchases rose 0.6% (-0.2% y/y). The rise contrasted with an earlier [...]
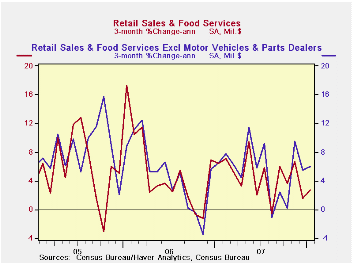
U.S. retail sales rose 0.3% during January following an unrevised 0.4% decline during December. The gain beat expectations for a 0.2% decline.
Motor vehicle & parts purchases rose 0.6% (-0.2% y/y). The rise contrasted with an earlier report of a 6.3% m/m decline in unit sales of light vehicles during January.
Excluding autos, retail sales last month barely exceeded
expectations and rose 0.3%. That made up a little revised 0.3% December
drop. November sales were revised down slightly.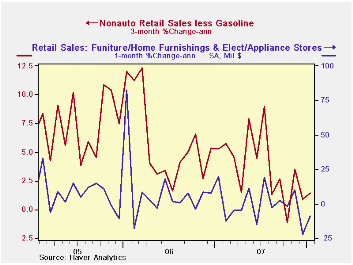
Higher gasoline prices provided lift to retail sales with a 2.0% (23.0% y/y) gain. That, in part, reflected a 0.8% m/m rise in gas prices. Less gasoline & autos, retail sales were unchanged and prior months' results were taken down.
Last month, sales of building materials fell 1.7% (-4.8% y/y). Taking out these very volatile components of retail spending to perhaps gain a better sense of underlying consumer spending growth, retail sales less autos, gasoline and building materials rose 0.2% last month (3.5% y/y).
Food & beverage store sales also provided lift to
January sales with a 0.6% (5.7% y/y) rise. Restaurant &
drinking place sales fell 0.5% (+4.4% y/y).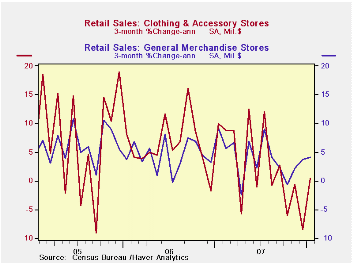
Sales of discretionary items generally were soft last month. Apparel store sales did rise 1.4% but that failed to fully make up a 2.3% December decline. Clothing store sales last month were 0.1% below the January level in 2007. Furniture, home furnishings & appliance store sales fell 0.7% (-3.0% y/y) for the third decline in the last four months. Sales of electronics & appliances dropped 1.0% after a 3.2% December slide. Sales at general merchandise stores rose 0.1% (2.4% y/y) after December's gain of 0.2%.
Sales of nonstore retailers (internet & catalogue) rose 0.5% (10.6% y/y).
Housing, Credit and Consumer Expenditure from the Federal Reserve Bank of Kansas City can be found here.
| January | December | Y/Y | 2007 | 2006 | 2005 | |
|---|---|---|---|---|---|---|
| Retail Sales & Food Services | 0.3% | -0.4% | 3.9% | 4.1% | 6.2% | 6.6% |
| Excluding Autos | 0.3% | -0.3% | 4.9% | 4.6% | 7.3% | 7.6% |
| Less Gasoline | 0.0% | -0.3% | 2.6% | 4.3% | 7.2% | 6.6% |
by Robert Brusca February 13, 2008
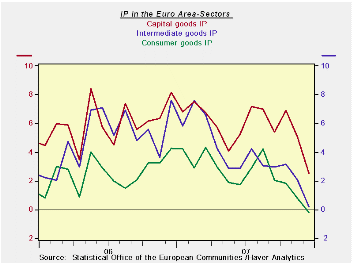
All EMU industrial sectors are seeing a considerable decline
in their rates of growth for industrial output. Capital goods has been
a strong sector in Europe and we have seen orders for capital goods
holding up especially in Germany. But on an EMU-wide basis capital
goods output is now declining over three months and its growth rate
year over year is declining as well. Consumer goods output has never
really been strong in this recovery and now it is showing signs of
decay from a low growth level. For the quarter industrial output is off
by about one percentage point.
Among countries Germany is the strongest but even its growth
rates show a deceleration in IP. France (excluding construction) is
holding up a bit better than Germany, but with a weaker Yr/Yr rate of
growth. Italy’s output shows a deep year/year decline for output. Spain
shows a shallow Yr/Yr decline. The UK has been pretty flat for most of
the past year.
For Q4 2007 Germany has the strongest contribution from IP at
3.4% Spain is next at 2.9% France is third at 1.1%. Italy has a
strongly negative -10.4% IP contraction in Q4. The UK has a small 0.5%
subtraction as IP sides in the fourth quarter.
Despite some stirring the Zew Survey for Germany we also saw
that the Zew current conditions assessment is sliding. A pick up in
sentiment for the future hangs on some rate cuts by the Fed, the
potential for more and a US stimulus package that has just been passed
into law. But the future remains cloudy and current conditions are
still very weak, and in some cases, getting weaker.
| Euro Area and UK IP and MFG | |||||||
|---|---|---|---|---|---|---|---|
| Saar except m/m | Mo/Mo | Dec-07 | Dec-07 | Dec-07 | |||
| Euro Area Detail | Dec-07 | Nov-07 | Oct-07 | 3-Mo | 6-mo | 12-mo | Q-2-Date |
| MFG | 0.0% | -0.5% | 0.6% | 0.2% | 1.3% | 1.1% | -1.0% |
| Consumer | 0.1% | -0.5% | 0.3% | -0.9% | 0.3% | -0.2% | -2.3% |
| Consumer Durables | 0.0% | -1.9% | -0.1% | -7.8% | -4.9% | -4.0% | -- |
| Consumer Nondurables | -0.1% | -0.2% | 0.2% | -0.4% | 0.8% | 0.2% | -- |
| Intermediate | 0.3% | -0.7% | 0.6% | 0.5% | 0.6% | 0.2% | -1.5% |
| Capital | -1.0% | -0.2% | 1.0% | -0.7% | 2.4% | 2.5% | 0.5% |
| Main Euro Area Countries and UK IP in MFG | |||||||
| Mo/Mo | 105.2 | 105.2 | 105.2 | ||||
| Memo: MFG | 1-Mo% | 1-Mo% | 1-Mo% | 3-Mo | 6-mo | 12-mo | Q-2-Date |
| Germany: | 0.9% | -0.2% | 0.0% | 3.0% | 6.1% | 5.3% | 3.4% |
| France: IP excl Construction | 0.7% | -1.7% | 2.0% | 3.9% | 3.3% | 1.2% | 1.1% |
| Italy | -0.5% | -1.7% | -0.8% | -11.5% | -6.7% | -6.4% | -10.8% |
| Spain | -1.5% | -6.7% | 10.2% | 5.5% | -3.3% | -0.3% | 2.9% |
| UK | -0.2% | -0.1% | 0.3% | 0.0% | -0.8% | 0.0% | -0.5% |
by Robert Brusca February 13, 2008
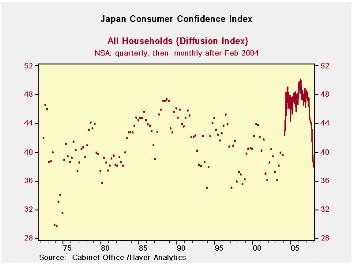
Japan’s consumer confidence survey did not used to be monthly.
That is why the chart shows its past as a quarterly report represented
by unconnected dots co-joined with its new form in which the dots are
connected month-to-month. Based on a full sample of observations back
to 1988 the current Consumer confidence readings are very weak. Based
on the data from 2004 onward when monthly reporting kicked in these are
the worst levels for all of the components that this report has seen.
But in its broader historic context, while overall livelihood is nearly
at an all-time low, employment is still above mid range in its 54th
percentile. Willingness to buy durable goods is weak in the bottom 25
percentile of its range. The same relative position is true of expected
income growth. People assess the value of their assets as in about the
bottom third of its historic range.
Clearly Japan is undergoing some difficulties. The consumer is
still very concerned about the future. While the OECD leading
indicators show Japan in an upswing of sorts, Japan’s own indicators
continue to show the economy bogged down with some conditions still
worsening.
| Japan Consumer Confidence | ||||||||
|---|---|---|---|---|---|---|---|---|
| Monthly | Change over | Percentile of range* | ||||||
| Dec-07 | Nov-07 | Oct-07 | 3-mos | 6-mos | 12-Mos | Since 2004 | Since 1988 | |
| Overall Livelihood | 34.9 | 37.0 | 41.0 | -7.3 | -7.5 | -8.6 | 0.0 | 0.0 |
| Income growth | 39.6 | 40.7 | 42.2 | -2.8 | -2.6 | -2.5 | 0.0 | 26.1 |
| Employment | 40.6 | 43.1 | 45.3 | -5.8 | -8.4 | -8.4 | 0.0 | 59.7 |
| Willing to buy Durable Goods | 37.0 | 38.4 | 42.8 | -8.5 | -9.4 | -11.9 | 0.0 | 27.3 |
| Value of Assets | 40.8 | 42.4 | 44.6 | -3.4 | -5.9 | -4.7 | 0.0 | 40.1 |
| For two-person households; * Percentiles since Mar 2004 when series became monthly or full period | ||||||||

Tom Moeller
AuthorMore in Author Profile »Prior to joining Haver Analytics in 2000, Mr. Moeller worked as the Economist at Chancellor Capital Management from 1985 to 1999. There, he developed comprehensive economic forecasts and interpreted economic data for equity and fixed income portfolio managers. Also at Chancellor, Mr. Moeller worked as an equity analyst and was responsible for researching and rating companies in the economically sensitive automobile and housing industries for investment in Chancellor’s equity portfolio. Prior to joining Chancellor, Mr. Moeller was an Economist at Citibank from 1979 to 1984. He also analyzed pricing behavior in the metals industry for the Council on Wage and Price Stability in Washington, D.C. In 1999, Mr. Moeller received the award for most accurate forecast from the Forecasters' Club of New York. From 1990 to 1992 he was President of the New York Association for Business Economists. Mr. Moeller earned an M.B.A. in Finance from Fordham University, where he graduated in 1987. He holds a Bachelor of Arts in Economics from George Washington University.
More Economy in Brief


