 Global| Apr 15 2008
U.S. PPI Soared
by:Tom Moeller
|in:Economy in Brief
Summary
Finished producer prices in the U.S. soared 1.1% last month, up sharply from the unrevised 0.3% February increase. The increase nearly doubled Consensus expectations for a 0.6% rise and it was the strongest rise since last November. [...]
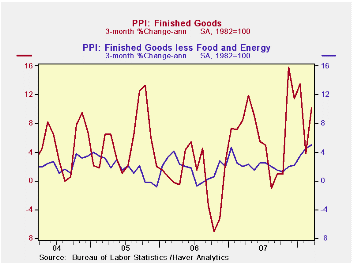
Finished producer prices in the U.S. soared 1.1% last month, up sharply from the unrevised 0.3% February increase. The increase nearly doubled Consensus expectations for a 0.6% rise and it was the strongest rise since last November.
Energy prices surged 2.9% (20.4% y/y) as home heating oil prices spiked by 13.1% (52.0% y/y) and natural gas prices increased 4.2% (4.0% y/y). Gasoline prices continued firm and rose 1.3% (36.4%).
Why Do Gasoline Prices React to Things That Have Not
Happened? from the Federal Reserve Bank of St. Louis is
available here.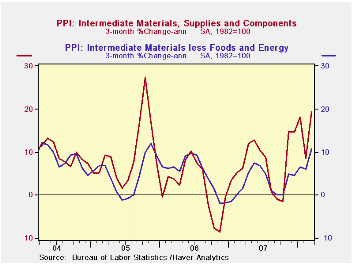
Finished consumer food prices spiked 1.2% (5.8% y/y). During the past three months food prices have risen at a 10.1% annual rate led by soaring egg prices (56.3% y/y), higher dairy prices (13.5% y/y), higher coffee prices (13.8% y/y) and higher bakery product prices (7.8% y/y). That strength has been offset somewhat by easier gains in prices for beef & veal (-0.3% y/y) and fresh fruits (0.0% y/y).
Less food and energy, prices matched expectations and rose a more moderate 0.2%, less than half the 0.5% February surge. Prices of core finished consumer goods rose 0.3% (3.3% y/y) due to strength in nondurable prices (4.4% y/y). Capital equipment prices rose a modest 0.1% (2.0% y/y), about equal to the rise for all of last year.
Intermediate goods prices surged 2.3% on the strength of a
2.9% (20.0% y/y) jump in food prices and a 5.9% (26.8% y/y) increase in
energy prices. Excluding food & energy, prices about doubled
the February rise with a 1.1% increase.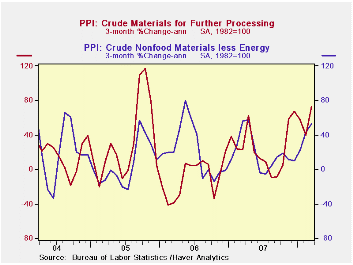
The crude materials PPI continued to surge and rose 8.0%.
Crude energy materials prices jumped another 13.4% (47.1% y/y) and food
prices jumped 2.0% (18.1% y/y). The core crude materials PPI also was
quite firm and rose 3.5%, about the same as it did in February. Prior
strength in prices for iron & steel scrap eased a bit to a
16.0% y/y rise. That was down from last year's full year increase of
21.4%.
Financial Market Turmoil and the Federal Reserve: The Plot Thickens is yesterday's speech by Federal Reserve Board Governor Kevin Warsh ad it can be found here.
| Producer Price Index (%) | March | February | Y/Y | 2007 | 2006 | 2005 |
|---|---|---|---|---|---|---|
| Finished Goods | 1.1 | 0.3 | 6.9 | 3.9 | 3.0 | 4.9 |
| Core | 0.2 | 0.5 | 2.8 | 1.9 | 1.5 | 2.4 |
| Intermediate Goods | 2.3 | 0.8 | 10.6 | 4.1 | 6.4 | 8.0 |
| Core | 1.1 | 0.6 | 5.5 | 2.8 | 6.0 | 5.5 |
| Crude Goods | 8.0 | 3.7 | 31.3 | 12.1 | 1.4 | 14.6 |
| Core | 3.5 | 3.3 | 16.7 | 15.7 | 20.8 | 4.9 |
by Tom Moeller April 15, 2008
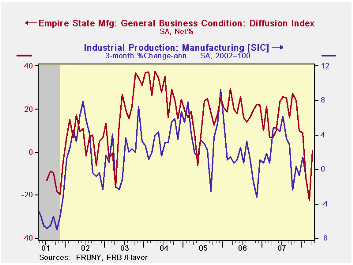
The April index of manufacturing activity in New York State recovered to 0.63% following the sharp falloff in March to a reading of -22.2%. It was better than expectations for continued weakness at a level of -17%. The figure is a diffusion index and it is reported by the Federal Reserve Bank of New York.
Since the series' inception in 2001 there has been a 55% correlation between the index level and the three month change in U.S. factory sector industrial production.
New orders, shipments and inventories each improved.
The employment index, however, deteriorated to a level of
0.00% from 4.49% in March. During all of 1Q08 the employment index
averaged 1.61% versus 11.28% averaged during all of last year. In the
(perhaps too) short six year history of the NY employment index, there
has been an 85% correlation between it and the three month growth in
overall factory sector employment.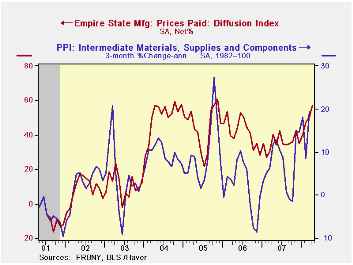
Like the Philadelphia Fed Index of General Business Conditions, the Empire State Business Conditions Index reflects answers to an independent survey question; it is not a weighted combination of the components.
Pricing pressure rose even further to an index level of 57.29, its highest since 2005. Since 2001 there has been an 81% correlation between the index of prices paid and the three month change in the core intermediate materials PPI.
The Empire State index of expected business conditions in six months fell to a reading near the recession low during 2001.
The Empire State Manufacturing Survey is a monthly survey of manufacturers in New York State conducted by the Federal Reserve Bank of New York. Participants from across the state in a variety of industries respond to a questionnaire and report the change in a variety of indicators from the previous month. Respondents also state the likely direction of these same indicators six months ahead. April 2002 is the first report, although survey data date back to July 2001.
For more on the Empire State Manufacturing Survey, including methodologies and the latest report, click here.
The Industrial Revolution and the Demographic Transition from the Federal Reserve Bank of Philadelphia is available here.
| Empire State Manufacturing Survey | April | March | April '07 | 2007 | 2006 | 2005 |
|---|---|---|---|---|---|---|
| General Business Conditions (diffusion index, %) | 0.63 | -22.23 | 7.00 | 17.23 | 20.24 | 15.53 |
| Prices Paid | 57.29 | 50.56 | 40.48 | 35.64 | 41.88 | 44.74 |
by Tom Moeller April 15, 2008
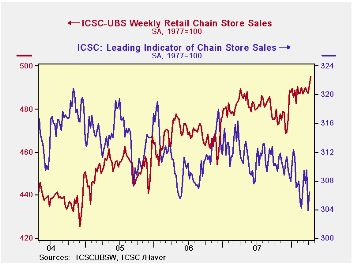
According to the International Council of Shopping Centers ICSC-UBS Chain Store survey, sales increased 0.9% last week and added to a 0.7% rise during the prior period. So far in April sales have risen 0.9% from March.
During the last ten years there has been a 45% correlation
between the y/y change in chain store sales and the change in nonauto
retail sales less gasoline.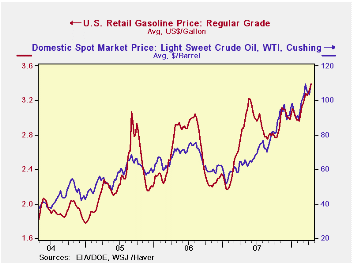
The ICSC-UBS retail chain-store sales index is constructed using the same-store sales (stores open for one year) reported by 78 stores of seven retailers: Dayton Hudson, Federated, Kmart, May, J.C. Penney, Sears and Wal-Mart.
During the latest week the leading indicator of chain store sales from ICSC-UBS recovered just a piece of the prior week's 1.8% plunge with a 0.8% increase.
Gasoline prices jumped another six cents last week to a record of $3.39 per gallon. In yesterday's trading the wholesale price of gasoline rose to $2.72 per gallon, up another four cents from last week's average./p>
Crude oil prices jumped five dollars w/w to $108.93 (74.0% y/y for a barrel of WTI crude. That price is up roughly thirteen dollars so far this year.
| ICSC-UBS (SA, 1977=100) | 04/12/08 | 04/05/08 | Y/Y | 2007 | 2006 | 2005 |
|---|---|---|---|---|---|---|
| Total Weekly Chain Store Sales | 495.3 | 490.8 | 1.8% | 2.8% | 3.3% | 3.6% |
| 04/14/08 | 04/07/08 | |||||
| Retail Gasoline ($ per gallon) | 3.39 | 3.33 | 17.8% | 2.80 | 2.57 | 2.27 |
by Louise Curley April 15, 2008
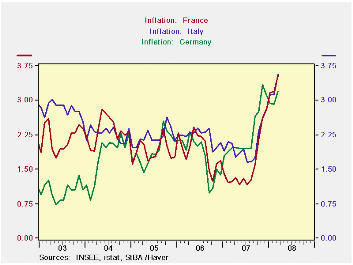
Concern over inflation is being fueled by today's releases of March inflation in Italy and France, both of which exceeded 3.5%. The year to year rate of increase in the Harmonized Index of Consumer Prices in Italy rose 3.57% and, in France, 3.53%. Inflation in March for Germany was released earlier and it was 3.2%. Inflation rates for France, Italy and Germany are shown in the second chart, where the sharp run up in inflation since last September is apparent.
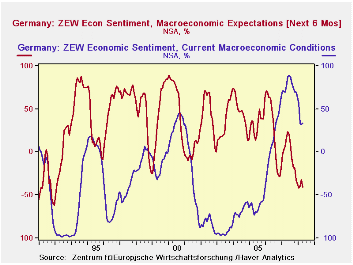
Institutional investors and analysts in the ZEW survey are still relatively comfortable with the present economic conditions--the excess of optimists over pessimists rose slightly in April to 33.2%. They have, however, become much more cautious about the next six months. The excess of pessimists over optimists regarding the next six months rose from 32.0% to 40.7%. This compares with the largest excess of pessimists of 62.2% in December, 1992. The third chart shows percent balances for current and expected conditions since the beginning of the series.
| INFLATION AND CONFIDENCE | Mar 08 | Feb 08 | Mar 07 | M/M Chg | Y/Y | 2007 | 2006 | 2005 |
|---|---|---|---|---|---|---|---|---|
| Inflation Y/Y % Chg in HICP | ||||||||
| Italy | 3.57 | 3.13 | 2.07 | 0.44 | 1.50 | 2.04 | 2.22 | 2.21 |
| France | 3.53 | 23.19 | 1.23 | 0.34 | 1.30 | 1.61 | 1.91 | 1.90 |
| Germany | 3.20 | 2.91 | 1.98 | 0.29 | 1.22 | 2.28 | 1.78 | 1.92 |
| ZEW(% Balance) | Apr 08 | Mar 08 | Apr 07 | M/M Chg | Y/Y Chg | 2007 | 2006 | 2005 |
| Current Economic Conditions | 33.2 | 32.1 | 70.6 | 1.1 | -43.7 | 75.9 | 18.3 | -61.8 |
| Expectations Next 6 Months | -40.7 | -32.0 | 16.5 | -8.7 | -57.2 | -3.0 | 22.3 | 34.8 |
by Robert Brusca April 15, 2008
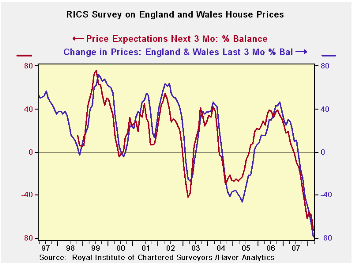
The Royal Institution of Chartered Surveyors' (RICS) said that 78.5% more surveyors reported a fall than a rise in house prices in March. This was the weakest reading since RICS began the survey back in 1978. Since 1999 new sales prices and price expectations are on the lowest readings we have seen.
Still anther house price survey, this one from an official source, the Department for Communities and Local Government (DCLG), provided evidence that house price pressures were easing in the UK but not yet actually falling. In that report, the DCLG found that annual house price inflation in February (not March) was up by 6.7%, lower than the 8.0% recorded on the same basis in January.
The average house price in February was Stg217,737, down from Stg221,278 in January, a monthly drop of 1.6%. The DCLG records prices when sales are concluded using data from completed mortgages and therefore are considered to be the most accurate of the surveys but they lag other market generated sources. Right now all methods are showing some weakening in home prices. The RICS survey results are among the most gloomy.
| RICS: House Prices and Expectations for Prices and Sales | Range | ||||||
|---|---|---|---|---|---|---|---|
| Mar-08 | Feb-08 | Jan-08 | 3Mo Avg | 6Mo Avg | 12Mo Avg | Percentile | |
| Prices | -79 | -66 | -55 | -67 | -52 | -22 | 0.0% |
| Price Expectations | -73 | -58 | -56 | -62 | -56 | -31 | 0.0% |
| Sales expectations | -15 | 1 | -11 | -8 | -10 | -4 | 7.8% |
| New Sales | -50 | -34 | -29 | -38 | -33 | -23 | 0.0% |
| Range percentile takes range back to 1999 | |||||||

Tom Moeller
AuthorMore in Author Profile »Prior to joining Haver Analytics in 2000, Mr. Moeller worked as the Economist at Chancellor Capital Management from 1985 to 1999. There, he developed comprehensive economic forecasts and interpreted economic data for equity and fixed income portfolio managers. Also at Chancellor, Mr. Moeller worked as an equity analyst and was responsible for researching and rating companies in the economically sensitive automobile and housing industries for investment in Chancellor’s equity portfolio. Prior to joining Chancellor, Mr. Moeller was an Economist at Citibank from 1979 to 1984. He also analyzed pricing behavior in the metals industry for the Council on Wage and Price Stability in Washington, D.C. In 1999, Mr. Moeller received the award for most accurate forecast from the Forecasters' Club of New York. From 1990 to 1992 he was President of the New York Association for Business Economists. Mr. Moeller earned an M.B.A. in Finance from Fordham University, where he graduated in 1987. He holds a Bachelor of Arts in Economics from George Washington University.
More Economy in Brief


