 Global| Dec 15 2009
U.S. PPI Jumps As Fuel CostsSurge; Core Prices Remain Strong
by:Tom Moeller
|in:Economy in Brief
Summary
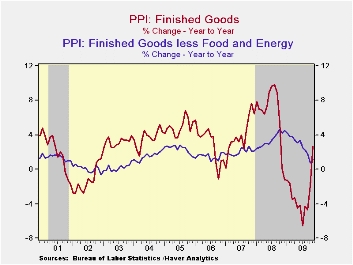
There was a broadening of inflationary pressure last month as measured by the producer price index. The PPI for finished goods jumped 1.8% after the tame 0.3% October increase. The rise was by far the largest increase in months and it [...]
 There
was a
broadening of inflationary pressure last month as measured by the
producer price index. The PPI for finished goods jumped 1.8% after the
tame 0.3% October increase. The rise was by far the largest increase in
months and it lifted the y/y gain to 2.7%, its fastest since October of
last year. In addition, the November increase was more-than-double the
Consensus expectation.
There
was a
broadening of inflationary pressure last month as measured by the
producer price index. The PPI for finished goods jumped 1.8% after the
tame 0.3% October increase. The rise was by far the largest increase in
months and it lifted the y/y gain to 2.7%, its fastest since October of
last year. In addition, the November increase was more-than-double the
Consensus expectation.
Higher energy costs led the strength in the PPI last month. The 6.9% increase lifted the y/y increase to 10.6%, its strongest since September 2008. Gasoline prices increased 8.2% (35.9% y/y). Elsewhere, the gain in energy prices was more moderate. Fuel oil prices increased 10.8% but they remained down 7.1% from last year. Natural gas prices also increased a lesser 3.9% and they were down 15.6% from the year ago level. Food prices increased a moderate 0.5% but the increase left prices 1.6% lower than last year. Beef & veal prices were off 8.4% y/y, dairy product prices fell 7.3% and vegetable prices slumped 3.2% y/y.
 Excluding
food
& energy prices rose 0.5% and reversed the October decline. The
m/m increase in the core PPI contrasted with expectations for a modest
0.2% increase. The PPI for finished consumer goods less food &
energy rose 0.5% (1.2% y/y) and also reversed the October
decline. Finished durables prices increased 0.6% (0.8% y/y)
while core finished consumer nondurable goods prices rose a modest 0.4%
(2.3% y/y). Capital equipment prices increased for the first time in
three months. The 0.4% increase nevertheless left prices up just 0.4%
y/y, nearly the weakest increase since 2003.
Excluding
food
& energy prices rose 0.5% and reversed the October decline. The
m/m increase in the core PPI contrasted with expectations for a modest
0.2% increase. The PPI for finished consumer goods less food &
energy rose 0.5% (1.2% y/y) and also reversed the October
decline. Finished durables prices increased 0.6% (0.8% y/y)
while core finished consumer nondurable goods prices rose a modest 0.4%
(2.3% y/y). Capital equipment prices increased for the first time in
three months. The 0.4% increase nevertheless left prices up just 0.4%
y/y, nearly the weakest increase since 2003.
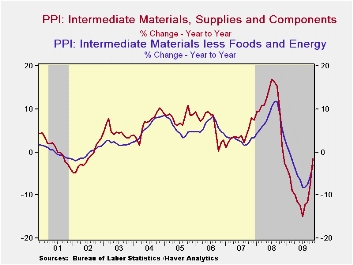
 Prices for intermediate
goods jumped 1.4%, reflecting the strength in energy prices. Core
prices also firmed and the 0.3% increase reversed the October decline.
The y/y gain in prices amounted to 0.3% which was a reversal from the
2.4% price deflation at the end of last year. Chemical, lumber and
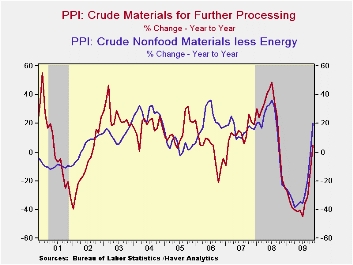
metals prices have firmed. The crude materials PPI again reflected the
strength in energy prices and rose 5.7%. Core prices gave back the
October gain but y/y were up 20.4% due to the improved economy.
Prices for intermediate
goods jumped 1.4%, reflecting the strength in energy prices. Core
prices also firmed and the 0.3% increase reversed the October decline.
The y/y gain in prices amounted to 0.3% which was a reversal from the
2.4% price deflation at the end of last year. Chemical, lumber and
metals prices have firmed. The crude materials PPI again reflected the
strength in energy prices and rose 5.7%. Core prices gave back the
October gain but y/y were up 20.4% due to the improved economy.
The producer price data is available in Haver's USECON database. More detailed data is in the PPI and in the PPIR databases.· Bank Relationships and the Depth of the Current Economic Crisis from the Federal Reserve Bank of San Francisco can be found here.
| Producer Price Index(%) | November | October | September | Y/Y | 2008 | 2007 | 2006 |
|---|---|---|---|---|---|---|---|
| Finished Goods | 1.8 | 0.3 | -0.6 | 2.7 | 6.4 | 3.9 | 2.9 |
| Core | 0.5 | -0.6 | -0.1 | 1.2 | 3.4 | 2.0 | 1.5 |
| Intermediate Goods | 1.4 | 0.3 | 0.2 | -1.5 | 10.5 | 4.0 | 6.4 |
| Core | 0.3 | -0.2 | 0.9 | -3.0 | 7.4 | 2.8 | 6.0 |
| Crude Goods | 5.7 | 5.4 | -2.1 | 4.8 | 21.4 | 11.9 | 1.4 |
| Core | -0.8 | 0.5 | 3.6 | 20.4 | 14.8 | 15.6 | 20.8 |
Rising Exports Fuel Rise in Japanese Industrial Production
by Louise Curley December 15, 2009
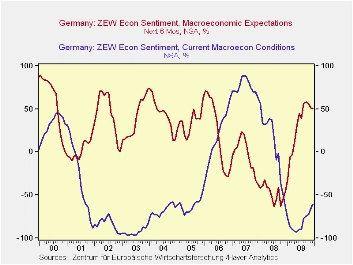 The ZEW
indicator of investors sentiment in Germany declined for the third
month in December. The percent balance of opinion on macro
expectations six months ahead is now at 50.4%, down 7.3 percentage
points from the peak of 57.7% in September. The
current level, however, is well above the long term average
of 27.0%. Although the balance between those respondents who
view current conditions negatively over those who view them positively
is still high at 60.6%, it declined five percentage points in December
and is well below the peak, 92.8%, reached in May of this year when it
was hard to find any optimists. The first chart shows the
percent balances for current conditions and the macro expectations over
the next six months.
The ZEW
indicator of investors sentiment in Germany declined for the third
month in December. The percent balance of opinion on macro
expectations six months ahead is now at 50.4%, down 7.3 percentage
points from the peak of 57.7% in September. The
current level, however, is well above the long term average
of 27.0%. Although the balance between those respondents who
view current conditions negatively over those who view them positively
is still high at 60.6%, it declined five percentage points in December
and is well below the peak, 92.8%, reached in May of this year when it
was hard to find any optimists. The first chart shows the
percent balances for current conditions and the macro expectations over
the next six months.
 The survey
is based on the opinions of 277
investors and analysts and took place from November 30 through December
14. During that period, data on new orders, industrial
production and retail sales for October were announced.
Industrial Production was down 1.86%, new orders for manufacturing were
down 2.57%, motor vehicle sales were down 1.37% and retail sales,
excluding motor vehicle sales, were flat. These data
suggested that the economic expansion might be somewhat slower than
earlier expectations and may have dampened some of the optimism of the
participants.
The survey
is based on the opinions of 277
investors and analysts and took place from November 30 through December
14. During that period, data on new orders, industrial
production and retail sales for October were announced.
Industrial Production was down 1.86%, new orders for manufacturing were
down 2.57%, motor vehicle sales were down 1.37% and retail sales,
excluding motor vehicle sales, were flat. These data
suggested that the economic expansion might be somewhat slower than
earlier expectations and may have dampened some of the optimism of the
participants.
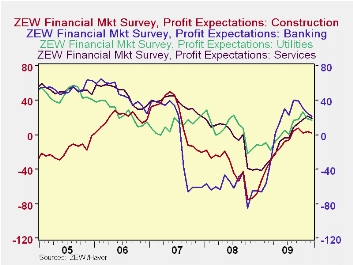
 In spite
of the decline in the overall outlook,
participants in the survey are still relatively optimistic regarding
the profit outlook. There are only four industries out of the
thirteen industries surveyed where the current balance of opinion is
for lower profits. These are: banking, construction,
utilities and services. They are shown in the second
chart. Of the remaining industries--insurance,
chemicals/pharmaceuticals, steel/metal, electronics, machinery,
telecommunications, information technology--the balance of opinion is
for higher profits; and for vehicles/automotive and consumption/trade,
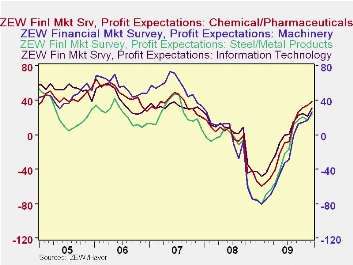
the balance of opinion is for smaller losses. The balance of
opinion for higher profits has risen significantly for the information
technology, machinery, steel/metal and chemicals/pharmaceuticals
industries, as can be seen in the third chart.
In spite
of the decline in the overall outlook,
participants in the survey are still relatively optimistic regarding
the profit outlook. There are only four industries out of the
thirteen industries surveyed where the current balance of opinion is
for lower profits. These are: banking, construction,
utilities and services. They are shown in the second
chart. Of the remaining industries--insurance,
chemicals/pharmaceuticals, steel/metal, electronics, machinery,
telecommunications, information technology--the balance of opinion is
for higher profits; and for vehicles/automotive and consumption/trade,
the balance of opinion is for smaller losses. The balance of
opinion for higher profits has risen significantly for the information
technology, machinery, steel/metal and chemicals/pharmaceuticals
industries, as can be seen in the third chart.
| Dec 09 | Nov 09 | Oct 09 | Sep 09 | Aug 09 | Jul 09 | Jun 09 | May 09 | April 09 | |
|---|---|---|---|---|---|---|---|---|---|
| Current Conditions | -60.6 | -65.6 | -72.2 | -74.0 | -77.2 | -89.3 | -89.7 | -92.8 | -91.6 |
| Macro Expectations (6 Months Ahead) | 50.4 | 51.1 | 56.0 | 57.7 | 56.1 | 39.5 | 44.8 | 31.1 | 13.0 |
Factory Production Resumes Increase
by Tom Moeller December 15, 2009
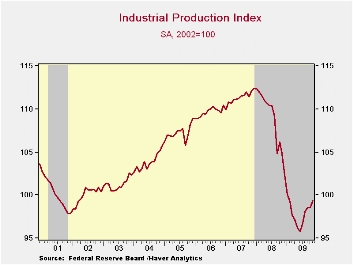 Industrial
production resumed the increase that began this past July. The November
0.8% gain followed an unrevised unchanged reading for October and it
exceeded Consensus expectations for a 0.6% rise. The improvement from
October was across-the-board but it was greatest in the construction
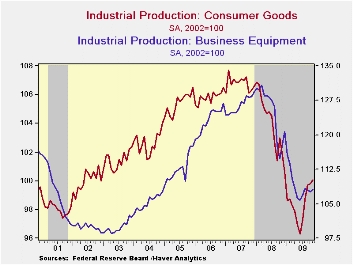
supplies and in the materials areas. Output of consumer goods rose a
moderate 0.3% and that was led by a 2.9% (-13.5% y/y) increase in
furniture production and a 1.9% (-6.9% y/y) increase in motor vehicle
output. Output of machinery also rose (-19.7% y/y) as did computers
& electronics (-4.0% y/y) production. Less the motor vehicle
& high-tech sectors output increased 0.8% (-5.1% y/y)
last month.
Industrial
production resumed the increase that began this past July. The November
0.8% gain followed an unrevised unchanged reading for October and it
exceeded Consensus expectations for a 0.6% rise. The improvement from
October was across-the-board but it was greatest in the construction
supplies and in the materials areas. Output of consumer goods rose a
moderate 0.3% and that was led by a 2.9% (-13.5% y/y) increase in
furniture production and a 1.9% (-6.9% y/y) increase in motor vehicle
output. Output of machinery also rose (-19.7% y/y) as did computers
& electronics (-4.0% y/y) production. Less the motor vehicle
& high-tech sectors output increased 0.8% (-5.1% y/y)
last month.
 During
November, production increases amongst
industries sagged somewhat to 52.9% of the total from the high of 60.6%
during August. The breadth of increase from last July also dipped to a
still-firm 59.9%, near the strongest since early-2007.
During
November, production increases amongst
industries sagged somewhat to 52.9% of the total from the high of 60.6%
during August. The breadth of increase from last July also dipped to a
still-firm 59.9%, near the strongest since early-2007.
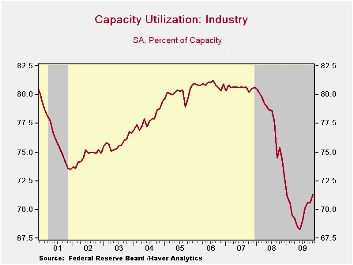 Capacity
utilization rose further to 71.3%, its
highest level since December. In the factory sector alone utilization
rose to 68.4%. Utilization in the primary metals area has risen sharply
to 59.1% with the rebound in output. There's also been a slight rise in
utilization in the machinery area but it's down most elsewhere. The
overall increase was caused by another estimated 0.1% (-0.9% y/y)
decline in industry capacity.
Capacity
utilization rose further to 71.3%, its
highest level since December. In the factory sector alone utilization
rose to 68.4%. Utilization in the primary metals area has risen sharply
to 59.1% with the rebound in output. There's also been a slight rise in
utilization in the machinery area but it's down most elsewhere. The
overall increase was caused by another estimated 0.1% (-0.9% y/y)
decline in industry capacity.
The industrial production data are available in Haver's USECON database.
| Industrial Production (SA,%) | November | October | September | Y/Y | 2008 | 2007 | 2006 |
|---|---|---|---|---|---|---|---|
| Total Output | 0.8 | 0.0 | 0.5 | -5.2 | -2.2 | 1.5 | 2.3 |
| Manufacturing | 1.1 | -0.2 | 0.6 | -4.8 | -3.2 | 1.4 | 2.5 |
| Consumer Goods | 0.3 | 0.1 | 1.0 | -1.9 | -2.6 | 0.9 | 0.4 |
| Business Equipment | 0.5 | -0.3 | -0.4 | -8.1 | -1.1 | 2.7 | 9.4 |
| Construction Supplies | 1.6 | -1.6 | -1.2 | -12.5 | -6.3 | -2.0 | 2.3 |
| Materials | 1.2 | 0.1 | 0.7 | -4.8 | -1.9 | 2.0 | 2.3 |
| Utilities | -1.8 | 1.6 | 0.3 | -5.1 | 0.3 | 3.4 | -0.6 |
| Capacity Utilization (%) | 71.3 | 70.6 | 70.0 | 74.4 (Nov. '08) | 77.5 | 80.6 | 80.9 |

Tom Moeller
AuthorMore in Author Profile »Prior to joining Haver Analytics in 2000, Mr. Moeller worked as the Economist at Chancellor Capital Management from 1985 to 1999. There, he developed comprehensive economic forecasts and interpreted economic data for equity and fixed income portfolio managers. Also at Chancellor, Mr. Moeller worked as an equity analyst and was responsible for researching and rating companies in the economically sensitive automobile and housing industries for investment in Chancellor’s equity portfolio. Prior to joining Chancellor, Mr. Moeller was an Economist at Citibank from 1979 to 1984. He also analyzed pricing behavior in the metals industry for the Council on Wage and Price Stability in Washington, D.C. In 1999, Mr. Moeller received the award for most accurate forecast from the Forecasters' Club of New York. From 1990 to 1992 he was President of the New York Association for Business Economists. Mr. Moeller earned an M.B.A. in Finance from Fordham University, where he graduated in 1987. He holds a Bachelor of Arts in Economics from George Washington University.
More Economy in Brief


