 Global| Nov 17 2009
U.S. PPI Increases 0.3% Fueled By Food & Energy Prices
by:Tom Moeller
|in:Economy in Brief
Summary
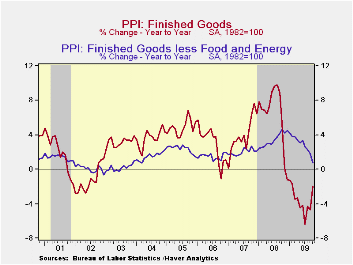
Inflationary pressures continued to be diffused last month by the weak economy, but they increased for those who eat or drive a car. The PPI for finished goods rose 0.3% during October following declines during two of the prior three [...]
 Inflationary
pressures continued to be diffused last month by the weak economy, but
they increased for those who eat or drive a car. The PPI for finished
goods rose 0.3% during October following declines during two of the
prior three months. The increase fell somewhat short of Consensus
expectations for a 0.5% rise. Though the PPI continued to decline
versus the year-ago level, the 1.9% drop is a moderation from the 6.4%
y/y decline back in July. Much of that moderation is due to notably
sharp price declines during last year's fourth quarter.
Inflationary
pressures continued to be diffused last month by the weak economy, but
they increased for those who eat or drive a car. The PPI for finished
goods rose 0.3% during October following declines during two of the
prior three months. The increase fell somewhat short of Consensus
expectations for a 0.5% rise. Though the PPI continued to decline
versus the year-ago level, the 1.9% drop is a moderation from the 6.4%
y/y decline back in July. Much of that moderation is due to notably
sharp price declines during last year's fourth quarter.
The increase in overall producer prices last month was led by a 1.6% (-2.5% y/y) rise in food & beverage prices which reflected the third monthly surge (NSA) in fruit & vegetable prices (15.2% y/y), a one-quarter spike in fresh & dry vegetable prices (-6.7% y/y) and higher dairy product prices (-11.3% y/y). A 1.6% increase in finished energy prices added to that monthly pressure, though prices still were down 9.4% y/y. Here again, however, the y/y comparisons are similar to those for food & beverage prices. Though prices remained 9.4% lower than last year, the twelve-month comparison has moderated from -29.6% this past July as monthly price declines during last year's fourth quarter were notably sharp. Despite m/m increases, gasoline prices remained down 12.5% y/y, fuel oil prices were off by one-third and natural gas prices were 20.1% lower.
 Excluding
food
& energy prices the PPI fell 0.6% during October. Not only was
the decline the third in the last four months, the 0.7% y/y increase
was the weakest since early-2004. The m/m decline in the core PPI
contrasted with expectations for a 0.1% increase. The PPI for finished
consumer goods less food & energy fell 0.5% yet gained 1.1%
y/y. That was the weakest annual increase since July 2007. Finished
durables prices cratered by 1.2% (0.0% y/y), and prices of core
finished consumer nondurable goods rose a modest 0.2%. The 2.0% y/y
increase was down from 5.9% as of last November. Capital equipment
prices also reflected economic weakness and fell 0.7%, the third
decline in the last four months. That pulled the y/y increase down to
0.1% after a 4.3% rise as of last December.
Excluding
food
& energy prices the PPI fell 0.6% during October. Not only was
the decline the third in the last four months, the 0.7% y/y increase
was the weakest since early-2004. The m/m decline in the core PPI
contrasted with expectations for a 0.1% increase. The PPI for finished
consumer goods less food & energy fell 0.5% yet gained 1.1%
y/y. That was the weakest annual increase since July 2007. Finished
durables prices cratered by 1.2% (0.0% y/y), and prices of core
finished consumer nondurable goods rose a modest 0.2%. The 2.0% y/y
increase was down from 5.9% as of last November. Capital equipment
prices also reflected economic weakness and fell 0.7%, the third
decline in the last four months. That pulled the y/y increase down to
0.1% after a 4.3% rise as of last December.
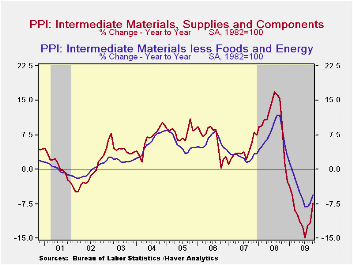
 Prices for
intermediate
goods rose 0.3% due to higher energy prices. The increase contrasted,
however, with a 0.2% decline in core prices. These were led by declines
in textile, chemical & lumber prices. Intermediate food prices
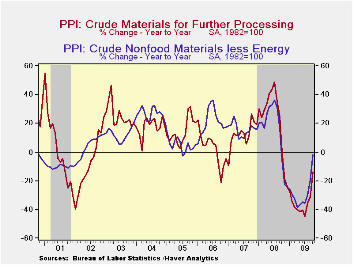
fell 0.2% (-8.4% y/y). The crude materials PPI increased a
sizable 5.4% due to the increase in energy prices though they still
remained down by nearly one-quarter from last October. In contrast,
core prices showed strength and increased for the seventh straight
month reflecting the steady rise in commodity prices.
Prices for
intermediate
goods rose 0.3% due to higher energy prices. The increase contrasted,
however, with a 0.2% decline in core prices. These were led by declines
in textile, chemical & lumber prices. Intermediate food prices
fell 0.2% (-8.4% y/y). The crude materials PPI increased a
sizable 5.4% due to the increase in energy prices though they still
remained down by nearly one-quarter from last October. In contrast,
core prices showed strength and increased for the seventh straight
month reflecting the steady rise in commodity prices.
The producer price data is available in Haver's USECON database. More detailed data is in the PPI and in the PPIR databases.
Short-Term Headline-Core Inflation Dynamics from the Federal Reserve Bank of Richmond is available here
| Producer Price Index(%) | October | September | August | Y/Y | 2008 | 2007 | 2006 |
|---|---|---|---|---|---|---|---|
| Finished Goods | 0.3 | -0.6 | 1.7 | -1.9 | 6.4 | 3.9 | 2.9 |
| Core | -0.6 | -0.1 | 0.2 | 0.7 | 3.4 | 2.0 | 1.5 |
| Intermediate Goods | 0.3 | 0.2 | 1.8 | -7.5 | 10.5 | 4.0 | 6.4 |
| Core | -0.2 | 0.9 | 0.6 | -5.6 | 7.4 | 2.8 | 6.0 |
| Crude Goods | 5.4 | -2.1 | 3.8 | -13.9 | 21.4 | 11.9 | 1.4 |
| Core | 0.5 | 3.6 | 6.0 | -1.5 | 14.8 | 15.6 | 20.8 |
by Tom Moeller November 17, 2009
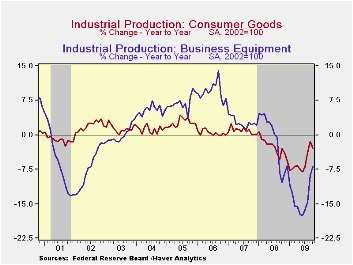
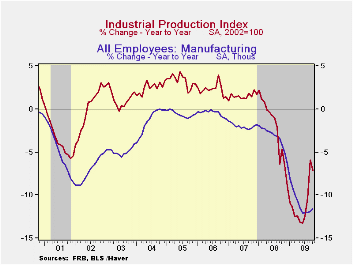 The
earlier
recovery in industrial production stalled last month after smart,
unrevised increases during the summer. The October reading of no change
in output also fell short of Consensus expectations for a 0.4% gain.
The weakening from earlier increases was widespread amongst sectors.
Output of consumer goods was unchanged after strong gains during the
prior three months. A 1.6% (-11.6% y/y) decline in motor vehicle output
led the weakening. Output of computers, video & audio
equipment also sagged by 0.3% (-8.2% y/y) after three months of
increase.
The
earlier
recovery in industrial production stalled last month after smart,
unrevised increases during the summer. The October reading of no change
in output also fell short of Consensus expectations for a 0.4% gain.
The weakening from earlier increases was widespread amongst sectors.
Output of consumer goods was unchanged after strong gains during the
prior three months. A 1.6% (-11.6% y/y) decline in motor vehicle output
led the weakening. Output of computers, video & audio
equipment also sagged by 0.3% (-8.2% y/y) after three months of
increase.
 Outside of
the auto &
high-tech sectors production ticked 0.1% higher during October (-6.9%
y/y) following three months of firm gain. The uptick was led
by a 3.6% (-18.8% y/y) jump in primary metals output, a 1.3% (-15.6%
y/y) rise in textile mills production and a 1.4% (-5.5% y/y) rise in
paper output. Working the other way, however, were widespread
declines. Furniture & appliance output continued to slide and
posted a 1.9% (-20.1% y/y) decline. Apparel output reversed two months
of increase with a 0.8% (-15.0% y/y) decline while petroleum &
coal output fell 2.9% (-5.0% y/y). Output of business equipment fell
0.3% (-6.8% y/y) with a 0.9% (-12.4% y/y) drop in electrical equipment
output. Reflecting continued weakness in nonresidential building
activity, output of construction supplies fell 1.2% (-17.0% y/y), about
as it did in September.
Outside of
the auto &
high-tech sectors production ticked 0.1% higher during October (-6.9%
y/y) following three months of firm gain. The uptick was led
by a 3.6% (-18.8% y/y) jump in primary metals output, a 1.3% (-15.6%
y/y) rise in textile mills production and a 1.4% (-5.5% y/y) rise in
paper output. Working the other way, however, were widespread
declines. Furniture & appliance output continued to slide and
posted a 1.9% (-20.1% y/y) decline. Apparel output reversed two months
of increase with a 0.8% (-15.0% y/y) decline while petroleum &
coal output fell 2.9% (-5.0% y/y). Output of business equipment fell
0.3% (-6.8% y/y) with a 0.9% (-12.4% y/y) drop in electrical equipment
output. Reflecting continued weakness in nonresidential building
activity, output of construction supplies fell 1.2% (-17.0% y/y), about
as it did in September.
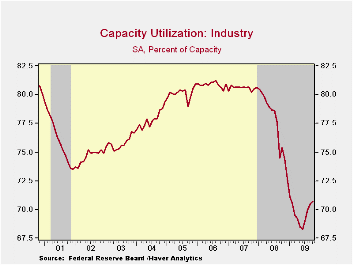 Despite
the weakening of output,
utilization of capacity ticked higher to 70.7%. The increase was caused
by an estimated 0.1% (-0.8% y/y) decline in industry capacity.
Utilization in the factory sector held steady at 67.9% though it was up
from the June low of 65.2%. Utilization in the primary metals are has
risen sharply to 56.9% with the rebound in output. There's also been a
rise in utilization in the machinery area but it's down most
elsewhere.
Despite
the weakening of output,
utilization of capacity ticked higher to 70.7%. The increase was caused
by an estimated 0.1% (-0.8% y/y) decline in industry capacity.
Utilization in the factory sector held steady at 67.9% though it was up
from the June low of 65.2%. Utilization in the primary metals are has
risen sharply to 56.9% with the rebound in output. There's also been a
rise in utilization in the machinery area but it's down most
elsewhere.
The industrial production data are available in Haver's USECON database.
Policy Challenges for the Federal Reserve is yesterday's speech by Fed Vice-Chairman Donald L. Kohn and it can be found here .
How Will Unemployment Fare Following the Recession? from the Federal Reserve Bank of Kansas City is available here.| INDUSTRIAL PRODUCTION (SA,%) | October | September | August | Y/Y | 2008 | 2007 | 2006 |
|---|---|---|---|---|---|---|---|
| Total Output | 0.0 | 0.7 | 1.2 | -7.2 | -2.2 | 1.5 | 2.3 |
| Manufacturing | -0.1 | 0.7 | 1.5 | -7.9 | -3.2 | 1.4 | 2.5 |
| Consumer Goods | 0.0 | 1.3 | 1.6 | -2.9 | -2.6 | 0.9 | 0.4 |
| Business Equipment | -0.3 | -0.4 | 1.1 | -6.8 | -1.1 | 2.7 | 9.4 |
| Construction Supplies | -1.2 | -1.1 | 0.7 | -17.0 | -6.3 | -2.0 | 2.3 |
| Utilities | 1.6 | -0.2 | 0.8 | -2.1 | 0.3 | 3.4 | -0.6 |
| Capacity Utilization | 70.7 | 70.5 | 70.0 | 75.4 (Oct. '08) | 77.5 | 80.6 | 80.9 |
by Robert Brusca November 17, 2009
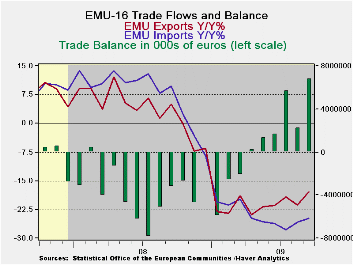
The EMU trade surplus continued to grow as exports rebounded strongly from a lackluster August that saw them fall by 4%. In September exports are back up, and off to the races.
Exports contribute to growth overallEMU exports now are off by 17.8% Yr/Yr, better than the 24.8% drop for imports. To this point the larger relative drop in imports makes the EMU trade sector a contributor to growth.
Exports are looking solid again Over recent months the contribution of exports to growth is looking even stronger- like a real force instead of a bit of subtle arithmetic. Over six months exports are rising at an 8.3% pace and over 3-months the growth rate is 25.6%. These metrics compare to import annual ‘growth’ rates of -8.5% over six months and of +3.4% over three months. Obviously EMU-region domestic demand is lagging in its developing as imports are still falling rapidly or barely heading higher depending on the period for that calculation. Meanwhile EMU exports are exploiting demand revival elsewhere.
Category-wide rebound in exportsAfter seeing declines across most key categories in August exports showed strong sharp category-wide improvements in September. Imports had a less widespread drop in August but are experiencing some revival in September as well.
Déjá vu all over again?EMU, like China and like Japan, is seeing a revival of export led growth. While China is being lauded for its huge domestic stimulus program at the end of the day it is a net exporter, its surplus is growing, so it is getting stimulus from overseas. Meanwhile the US trade deficit popped up in the wake of surging oil imports and auto imports that came on the heels of its cash for clunkers auto sector stimulus program. Even though the US consumer is late to revive in this cycle foreigners have been quick to glean whatever spoils there are in the US market. All this smacks of business as usual. If the global economy is to be made safer, business as usual will have to change its stripes. Europe, Japan and China if they are to hold their exports focus will have to find markets other than the US to exploit or it will be déjá vu all over again, as that sage Yogi Berra once said.
Ezone Trade Trends For Goods| m/m% | % Saar | |||||
| Sep-09 | Aug-09 | 3M | 6M | 12M | 12M Ago | |
| Balance* | € 6,801 | € 2,235 | € (6,433) | € 2,976 | €(3,092) | € 1,842 |
| Exports | ||||||
| All Exp | 5.5% | -4.1% | 25.6% | 8.3% | -17.8% | 4.9% |
| Food and Drinks | 2.8% | -5.1% | 3.9% | 0.3% | -10.2% | 11.6% |
| Raw materials | 1.7% | -5.0% | 12.6% | 9.1% | -14.7% | 2.2% |
| Other | 5.8% | -4.0% | 27.8% | 9.0% | -18.5% | 4.6% |
| MFG | 2.6% | -6.4% | 13.5% | -5.4% | -21.7% | 1.6% |
| IMPORTS | ||||||
| All IMP | 1.1% | -1.0% | 3.4% | -8.5% | -24.8% | 9.7% |
| Food and Drinks | 1.2% | -2.6% | -1.5% | -17.1% | -10.7% | 1.5% |
| Raw materials | -1.2% | 3.9% | 19.8% | -7.4% | -39.4% | 14.5% |
| Other | 1.2% | -1.0% | 3.2% | -7.9% | -24.9% | 10.0% |
| MFG | 1.3% | -1.4% | 3.3% | -12.7% | -20.4% | 0.5% |
| *Eur mlns; mo or period average | ||||||
by Louise Curley November 17, 2009
 The news
from Canada continues to raise doubts about the forecast of a 2% rise
in GDP in the third quarter made earlier by Mark Carney, Governor of
the Bank of Canada. Monthly GDP declined in July and August.
The continued strength of the C$ is affecting
exports.
The news
from Canada continues to raise doubts about the forecast of a 2% rise
in GDP in the third quarter made earlier by Mark Carney, Governor of
the Bank of Canada. Monthly GDP declined in July and August.
The continued strength of the C$ is affecting
exports.
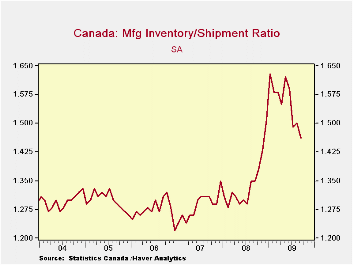
Today, data on sales, new and unfilled orders and inventories were released for the manufacturing sector and they were mixed. Manufacturing sales were lower than expected but the pace of new orders and inventories was more encouraging. New orders increased 8.3% in September after having declined in July and August. Inventories continue to decline and the inventory sales ratio is now down to 1.46 from it peak of 1.63 in January of this year. The ratio is shown in the first chart and is approaching what looks like a normal ratio of around 1.30.
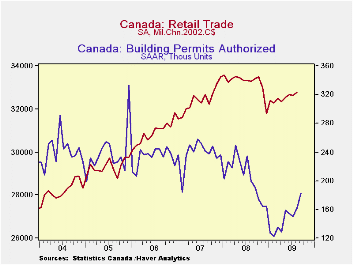 While
there may be some doubts about the
magnitude of the rise in Canada's third quarter GDP, there is no doubt
that the Canadian economy is at a turning point and will show some
growth in the third quarter. Most of the data relating to the
Canadian economy released recently has been erratic--a step forward,
then some retraction. Nevertheless, the forward momentum has
generally overcome the retraction. In addition to
manufacturing sales, the number of building permits authorized and
retail sales are good examples of such data and they are shown in the
second chart. Recent changes in both series are volatile, but
the trend for both is clearly positive.
While
there may be some doubts about the
magnitude of the rise in Canada's third quarter GDP, there is no doubt
that the Canadian economy is at a turning point and will show some
growth in the third quarter. Most of the data relating to the
Canadian economy released recently has been erratic--a step forward,
then some retraction. Nevertheless, the forward momentum has
generally overcome the retraction. In addition to
manufacturing sales, the number of building permits authorized and
retail sales are good examples of such data and they are shown in the
second chart. Recent changes in both series are volatile, but
the trend for both is clearly positive.
| Manufacturing | Sep 09 | Aug 09 | Jul 09 | Jun 09 | May 09 | Apr 09 |
|---|---|---|---|---|---|---|
| Shipments (M/M % Chg) | 1.43% | -1.77% | 5.17% | 3.28% | -4.44% | -0.36% |
| New Orders (M/M % Chg) | 8.26% | -1.20% | -5.68% | 20.38% | -6.29% | -11.16% |
| Unfilled Orders (M/M % Chg) | -0.57% | -5.06% | -5.26% | 2.11% | -7.04% | -5.88% |
| Inventories (M/M Change in Mil. C$) | -1166.909 | -299.573 | -1257.203 | -160.873 | -1117.464 | -719.741 |
| Inventories/Sales Ratio | 1.46 | 1.50 | 1.49 | 1.59 | 1.62 | 1.55 |

Tom Moeller
AuthorMore in Author Profile »Prior to joining Haver Analytics in 2000, Mr. Moeller worked as the Economist at Chancellor Capital Management from 1985 to 1999. There, he developed comprehensive economic forecasts and interpreted economic data for equity and fixed income portfolio managers. Also at Chancellor, Mr. Moeller worked as an equity analyst and was responsible for researching and rating companies in the economically sensitive automobile and housing industries for investment in Chancellor’s equity portfolio. Prior to joining Chancellor, Mr. Moeller was an Economist at Citibank from 1979 to 1984. He also analyzed pricing behavior in the metals industry for the Council on Wage and Price Stability in Washington, D.C. In 1999, Mr. Moeller received the award for most accurate forecast from the Forecasters' Club of New York. From 1990 to 1992 he was President of the New York Association for Business Economists. Mr. Moeller earned an M.B.A. in Finance from Fordham University, where he graduated in 1987. He holds a Bachelor of Arts in Economics from George Washington University.
More Economy in Brief


