 Global| Jun 17 2008
U.S. PPI Increase Largest Since November, Gain in Core Prices Eased
by:Tom Moeller
|in:Economy in Brief
Summary
U.S. finished producer prices jumped 1.4% last month and the increase was the largest since a 2.6% rise last November. The increase surpassed Consensus expectations for a 1.0% rise. Finished energy prices surged 4.9% (19.4% y/y) as [...]
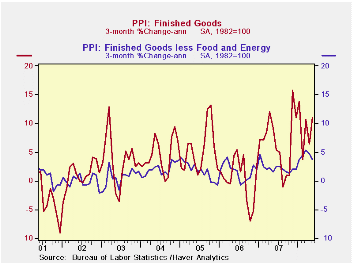
U.S. finished producer prices jumped 1.4% last month and the increase was the largest since a 2.6% rise last November. The increase surpassed Consensus expectations for a 1.0% rise.
Finished energy prices surged 4.9% (19.4% y/y) as gasoline prices jumped 9.3% (26.3% y/y). Natural gas prices also were quite strong and they rose 3.1% (12.4% y/y) while home heating oil prices increased 8.0% (58.4% y/y). Residential electric power costs rose 0.6% (4.8% y/y).
Finished consumer food prices were strong again and rose 0.8% (6.6% y/y). The strength was led by fresh vegetables (17.1% y/y), pasta products (37.8% y/y) and dairy products (7.0% y/y). Meat prices continued to decline.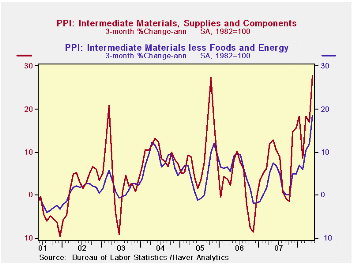
Less food & energy, the gain in finished goods prices eased to 0.2% from 0.4% in April. The latest figure matched expectations. Prices of core finished consumer goods rose 0.3% (3.5% y/y) and the annual rate of increase leveled out. Durable consumer goods prices reversed the April increase and fell 0.4% (1.7% y/y). Capital equipment prices rose 0.1% (2.3% y/y).
Intermediate goods prices surged by 2.9% after the 0.9% April increase. Excluding food & energy these prices spiked another 2.0%.
The crude materials PPI jumped 6.7% due to a 13.1% (67.0% y/y) spike in energy prices. Crude food prices also were strong and jumped 1.8% (16.7% y/y). Crude petroleum prices have more than doubled y/y while natural gas prices also surged by 17.0% (49.7% y/y).
Inflation Regimes and Inflation Expectations from the Federal Reserve Bank of St. Louis is available here.
| Producer Price Index (%) | May | April | Y/Y | 2007 | 2006 | 2005 |
|---|---|---|---|---|---|---|
| Finished Goods | 1.4 | 0.2 | 7.2 | 3.9 | 3.0 | 4.9 |
| Core | 0.2 | 0.4 | 3.0 | 1.9 | 1.5 | 2.4 |
| Intermediate Goods | 2.9 | 0.9 | 12.5 | 4.1 | 6.4 | 8.0 |
| Core | 2.0 | 1.2 | 7.4 | 2.8 | 6.0 | 5.5 |
| Crude Goods | 6.7 | 3.2 | 41.7 | 12.1 | 1.4 | 14.6 |
| Core | 5.0 | 7.9 | 33.2 | 15.7 | 20.8 | 4.9 |

Tom Moeller
AuthorMore in Author Profile »Prior to joining Haver Analytics in 2000, Mr. Moeller worked as the Economist at Chancellor Capital Management from 1985 to 1999. There, he developed comprehensive economic forecasts and interpreted economic data for equity and fixed income portfolio managers. Also at Chancellor, Mr. Moeller worked as an equity analyst and was responsible for researching and rating companies in the economically sensitive automobile and housing industries for investment in Chancellor’s equity portfolio. Prior to joining Chancellor, Mr. Moeller was an Economist at Citibank from 1979 to 1984. He also analyzed pricing behavior in the metals industry for the Council on Wage and Price Stability in Washington, D.C. In 1999, Mr. Moeller received the award for most accurate forecast from the Forecasters' Club of New York. From 1990 to 1992 he was President of the New York Association for Business Economists. Mr. Moeller earned an M.B.A. in Finance from Fordham University, where he graduated in 1987. He holds a Bachelor of Arts in Economics from George Washington University.
More Economy in Brief


