 Global| Aug 14 2007
U.S. PPI Above Forecasts; Weak Core Prices As Expected
by:Tom Moeller
|in:Economy in Brief
Summary
Finished producer prices rose 0.6% last month, twice the Consensus forecast for a 0.3% rise. That followed a 0.2% decline during June. The increase raised the y/y gain in prices to 3.9%, its highest in a year. The core finished goods [...]
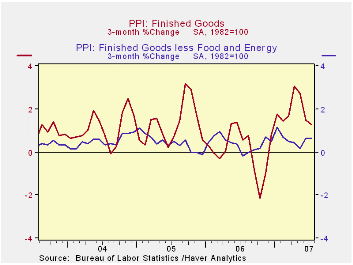
Finished producer prices rose 0.6% last month, twice the Consensus forecast for a 0.3% rise. That followed a 0.2% decline during June. The increase raised the y/y gain in prices to 3.9%, its highest in a year.
The core finished goods PPI increased a modest and expected 0.1%, down from the 0.3% gain in June. The increase was a bit below the average monthly increase of 0.2% so far this year.
Energy prices surged 2.5% as gasoline prices jumped 5.1% (6.4% y/y) and fuel oil prices rose 1.1% (1.6% y/y).Natural gas prices also were strong and posted a 3.2% (9.0% y/y) gain.
Food prices fell 0.1% (+6.2% y/y) following the 0.8% jump during June. Lower prices for meat and pork offset higher costs for dairy products. 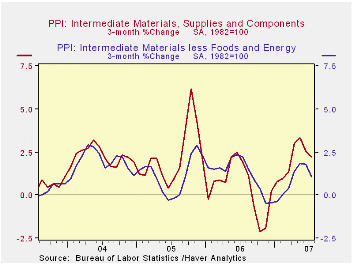
Finished consumer goods prices less food & energy rose 0.2% (2.4% y/y). Passenger car prices reversed the strong June gain with a 1.2% decline (+1.1% y/y) and household furniture prices also fell a modest 0.1% (NSA,+1.4% y/y).
Capital equipment prices fell 0.2% (+2.3% y/y) after a 0.1% uptick in June. Prices of light motor trucks fell and costs of heavy trucks were unchanged (6.8% y/y) for the third consecutive month.
Intermediate goods prices were firm again and rose 0.6% after a 0.5% June rise. Food prices were strong with a 0.8% (15.3% y/y) jump. The index excluding food & energy prices rose 0.2% (2.5% y/y).
The crude materials PPI jumped 1.2% due to the 11.8% rise in crude oil prices (-3.2% y/y). The core crude materials PPI was unchanged as most metal prices fell.
Inflation Dynamics, remarks by Federal Reserve Board Governor Frederic S. Mishkin, are available here.
| Producer Price Index | July | June | Y/Y | 2006 | 2005 | 2004 |
|---|---|---|---|---|---|---|
| Finished Goods | 0.6% | -0.2% | 3.9% | 2.9% | 4.9% | 3.6% |
| Core | 0.1% | 0.3% | 2.4% | 1.4% | 2.4% | 1.5% |
| Intermediate Goods | 0.6% | 0.5% | 3.9% | 6.4% | 8.0% | 6.6% |
| Core | 0.2% | 0.4% | 2.5% | 6.0% | 5.5% | 5.7% |
| Crude Goods | 1.2% | 0.3% | 13.2% | 1.4% | 14.6% | 17.5% |
| Core | 0.0% | -0.2% | 8.5% | 20.9% | 4.9% | 26.5% |

Tom Moeller
AuthorMore in Author Profile »Prior to joining Haver Analytics in 2000, Mr. Moeller worked as the Economist at Chancellor Capital Management from 1985 to 1999. There, he developed comprehensive economic forecasts and interpreted economic data for equity and fixed income portfolio managers. Also at Chancellor, Mr. Moeller worked as an equity analyst and was responsible for researching and rating companies in the economically sensitive automobile and housing industries for investment in Chancellor’s equity portfolio. Prior to joining Chancellor, Mr. Moeller was an Economist at Citibank from 1979 to 1984. He also analyzed pricing behavior in the metals industry for the Council on Wage and Price Stability in Washington, D.C. In 1999, Mr. Moeller received the award for most accurate forecast from the Forecasters' Club of New York. From 1990 to 1992 he was President of the New York Association for Business Economists. Mr. Moeller earned an M.B.A. in Finance from Fordham University, where he graduated in 1987. He holds a Bachelor of Arts in Economics from George Washington University.
More Economy in Brief


