 Global| Apr 20 2010
U.S. Petroleum Prices Remain NearHigh But Spot Prices Fall
by:Tom Moeller
|in:Economy in Brief
Summary
The trend has been upward for the cost of regular gasoline. Last week the price for a gallon remained at the prior week's high of $2.86 which was up by 78% since the December, 2008 low. At the margin, however, there's been some [...]
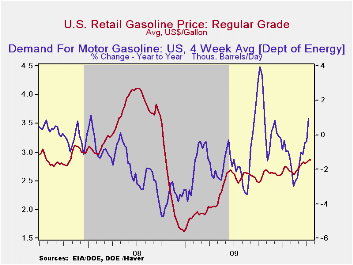
The trend has been upward for the cost of regular gasoline. Last week the price for a gallon remained at the prior week's high of $2.86 which was up by 78% since the December, 2008 low. At the margin, however, there's been some shakiness. Yesterday, the spot market price for a gallon of regular gasoline fell back by ten cents from the early-April high. The figures are reported by the U.S. Department of Energy and can be found in Haver's WEEKLY & DAILY databases.
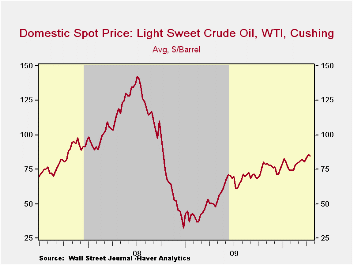
Crude oil costs have been behind the gasoline price volatility. The price for a barrel of light sweet crude (WTI) fell a modest 1.6% last week to $84.60 from $85.97 but then fell twice that percent yesterday to $81.45. Regardless, prices remain up by two-and-one half times the 2008 low
The easing of gasoline prices has had nothing to due with the trend in demand. Weekly gasoline usage has been trending higher with more temperate weather and the improved economy. It was up 1.0% last week versus one year ago and that compares with a 3.0% decline in early-February. The demand for residual fuel oil fell 1.6% and distillate demand fell 4.8% y/y. Inventories of crude oil and petroleum products were stable through much of last month and were down slightly from one year ago.
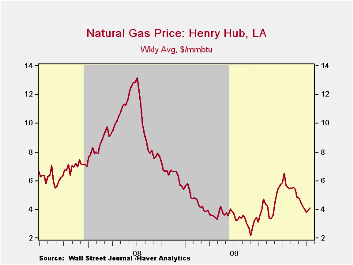
U.S. natural gas prices were up slightly last week at $4.09 per mmbtu (+15.3% y/y). Prices reached a high of $6.50 early in January. Nevertheless, prices remained nearly double the September low.
The energy price data can be found in Haver's WEEKLY database while the daily figures are in DAILY. The gasoline demand figures are in OILWKLY.
Lessons from the failure of Lehman Brothers is this morning's House testimony by Fed Chairman Ben S. Bernanke and it can be found here.
| Weekly Prices | 04/17/10 | 04/12/10 | 04/05/10 | Y/Y | 2009 | 2008 | 2007 |
|---|---|---|---|---|---|---|---|
| Retail Regular Gasoline ($ per Gallon, Regular) | 2.86 | 2.86 | 2.83 | 38.9% | 2.35 | 3.25 | 2.80 |
| Light Sweet Crude Oil, WTI ($ per bbl.) | 84.60 | 85.97 | 83.29 | 69.9% | 61.39 | 100.16 | 72.25 |
by Tom Moeller April 20, 2010
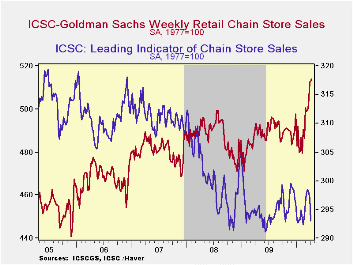
Consumers still seem interested in spending money after being cooped up indoors this winter. As a result, chain store sales last week held onto the sharp gain early in the month and the y/y change remained at 4.6%, its strongest gain since early-2007.
During the last ten years there has been a 68% correlation between the y/y change in chain store sales and the change in retail sales at general merchandise stores.
That correlation recently has increased.The ICSC-Goldman Sachs retail chain-store sales index is constructed using the same-store sales (stores open for one year) reported by 78 stores of seven retailers: Dayton Hudson, Federated, Kmart, May, J.C. Penney, Sears and Wal-Mart.
During the last ten years there has been a 69% correlation between the year-to-year growth in chain store sales and the growth in general merchandise retail sales. The weekly figures are available in Haver's SURVEYW database.Contrary to the trend in purchases, the leading indicator of chain store sales slipped last week and was down slightly versus one year ago. The composite leading economic indicator is compiled from four series: (1) the MBA's volume index of mortgage applications for home purchase (2) the ABC News/Money magazine's survey of consumer buying conditions (3) new filings for jobless benefits and (4) the 30-year government bond yield.
Issues in Economic Development is yesterday's speech by Fed Governor Elizabeth A. Duke and it can be found here.
| ICSC-UBS (SA, 1977=100) | 04/17/10 | 04/10/10 | 04/03/10 | Y/Y | 2009 | 2008 | 2007 |
|---|---|---|---|---|---|---|---|
| Total Weekly Chain Store Sales | 513.8 | 513.0 | 512.7 | 4.6% | 0.1% | 1.4% | 2.8% |
by Louise Curley April 20, 2010
 The
German
financial community is upbeat on Germany's economic prospects over the
next six months despite the disruptions caused by the eruption of the
Icelandic volcano. The ZEW Survey of institutional investors
and analysts took place over the period, March 29 to April 19, that
latter part of which was affected by the eruption of the
volcano. The survey revealed that those expecting
macroeconomic conditions to improve over the next six months exceeded
those expecting conditions to worsen by 53% up from 44.5% in
March. This was the first increase since September of last
year and its magnitude exceeded consensus estimates of a
rise.
The
German
financial community is upbeat on Germany's economic prospects over the
next six months despite the disruptions caused by the eruption of the
Icelandic volcano. The ZEW Survey of institutional investors
and analysts took place over the period, March 29 to April 19, that
latter part of which was affected by the eruption of the
volcano. The survey revealed that those expecting
macroeconomic conditions to improve over the next six months exceeded
those expecting conditions to worsen by 53% up from 44.5% in
March. This was the first increase since September of last
year and its magnitude exceeded consensus estimates of a
rise.
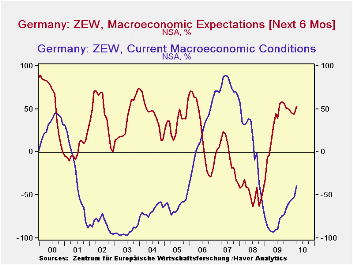
The
change in the appraisal of current conditions was even
greater. The financial community has
had a dim view of current conditions since August, 2008 when the
 pessimists
regarding current conditions began to exceed the
optimists. By May 2009 the excess of pessimists reached
92.8%. Since then, there has been a steady decline
in the percentage of pessimists. In April, the excess of
pessimists was 39.2% an 11.7 point decline from the 51.9% of March. The
percent balances between optimist and pessimists regarding current
conditions and expectations for the next six months are shown in the
first chart.
pessimists
regarding current conditions began to exceed the
optimists. By May 2009 the excess of pessimists reached
92.8%. Since then, there has been a steady decline
in the percentage of pessimists. In April, the excess of
pessimists was 39.2% an 11.7 point decline from the 51.9% of March. The
percent balances between optimist and pessimists regarding current
conditions and expectations for the next six months are shown in the
first chart.
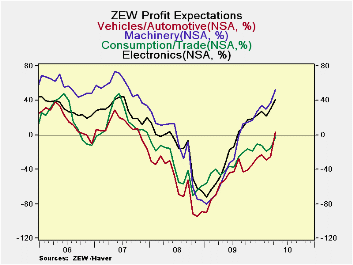
The improved appraisal of current conditions and expectations has led to some changes in profit expectations. The second chart shows those industries where profit expectations have increased the most in the last month. Although expectations for profits in the Vehicles/Automotive and Consumption/Trade are small and even negative in the case of the latter, expectations for profits in both these industries have increased the most in the last month. Profit expectations for these industries and two other industries where profit expectations have had big increases--Machinery and Electronics--are shown in the second chart.
Over the past few months the economic news in Germany had been encouraging. The euro has declined almost 11% since early December. Unemployment continues to fall and new orders, particularly foreign, have been strong. may have contributed to the good feeling in the financial community
| Percent | Apr 10 | Mar 10 | Feb 10 | Jan 10 | Dec 09 | Nov 09 | Oct 09 | Sep 09 |
|---|---|---|---|---|---|---|---|---|
| Expectation 6 mo Ahead | 53.0 | 44.5 | 15.1 | 47.2 | 50.4 | 56.1 | 56.0 | 57.7 |
| Current Conditions | -39.2 | -51.9 | -54.8 | -56.6 | -60.6 | -65.6 | -72.2 | -74.0 |
| Profit Expectations | ||||||||
| Vehicles/Automotive | 3.1 | -25.4 | -29.7 | -23.2 | -26.5 | -33.9 | -40.9 | -43.0 |
| Consumption/Trade | -2.3 | -15.6 | -18.9 | -12.1 | -10.4 | -18.4 | -16.7 | -20.4 |
| Machinery | 52.1 | 36.7 | 29.6 | 33.8 | 26.9 | 16.8 | 14.4 | 12.7 |
| Electronics | 41.2 | 29.8 | 22.0 | 27.0 | 22.8 | 18.1 | 17.4 | 9.1 |

Tom Moeller
AuthorMore in Author Profile »Prior to joining Haver Analytics in 2000, Mr. Moeller worked as the Economist at Chancellor Capital Management from 1985 to 1999. There, he developed comprehensive economic forecasts and interpreted economic data for equity and fixed income portfolio managers. Also at Chancellor, Mr. Moeller worked as an equity analyst and was responsible for researching and rating companies in the economically sensitive automobile and housing industries for investment in Chancellor’s equity portfolio. Prior to joining Chancellor, Mr. Moeller was an Economist at Citibank from 1979 to 1984. He also analyzed pricing behavior in the metals industry for the Council on Wage and Price Stability in Washington, D.C. In 1999, Mr. Moeller received the award for most accurate forecast from the Forecasters' Club of New York. From 1990 to 1992 he was President of the New York Association for Business Economists. Mr. Moeller earned an M.B.A. in Finance from Fordham University, where he graduated in 1987. He holds a Bachelor of Arts in Economics from George Washington University.
More Economy in Brief


