 Global| Nov 01 2007
U.S. Personal Spending Up 0.3%, Income Rose 0.4%
by:Tom Moeller
|in:Economy in Brief
Summary
Personal consumption expenditures rose 0.3% in September, below the downwardly revised 0.5% August increase and below expectations for a 0.4% rise. A pattern of steadily declining rates of increase prevailed through 2007; 1Q up 7.3% [...]

Personal consumption expenditures rose 0.3% in September, below the downwardly revised 0.5% August increase and below expectations for a 0.4% rise. A pattern of steadily declining rates of increase prevailed through 2007; 1Q up 7.3% (AR), 2Q up 5.7%, 3Q 4.7%.
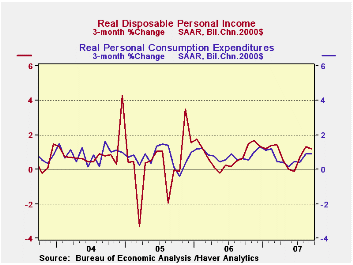
Most of that slowdown, however, reflects easier price gains. Adjusted for inflation, consumption rose 3.0% last quarter following a 1.4% 2Q gain and a 3.7% 1Q increase. For the year as a whole 2007 real personal consumption should turn in a 3.1% rise, the same as during 2006.
For September, the slower real increase of 0.1% versus a 0.6% August jump reflected a much easier 0.7% rise in auto sales. In the nondurable area spending on tobacco and clothing dropped. In the services area spending on recreation and electricity & gas consumption fell. These (perhaps too) fine levels of detail are available in Haver's USNA database.
Personal income rose 0.4% in September, the same as during an upwardly revised August, in line with Consensus forecasts.
Wages & salaries rose 0.6% (7.1% y/y), ahead of the upwardly revised 0.4% August increase. Factory sector wages were unchanged (6.2% y/y), about as they had been m/m during all of 3Q.Wage & salary income in the service-producing industries recovered 0.8% (8.1% y/y) and wages in the government sector rose 0.4% (4.4% y/y).
Interest income grew 0.5% (4.7% y/y), stronger with the rise in interest rates, and dividend income popped another 0.9% (13.3% y/y).
Personal current taxes rose 0.5% (10.3% y/y). As a result, disposable personal income grew 0.4% (6.3% y/y). Adjusted for inflation, disposable personal income rose 0.2% (3.9% y/y) after a 0.5% August increase.
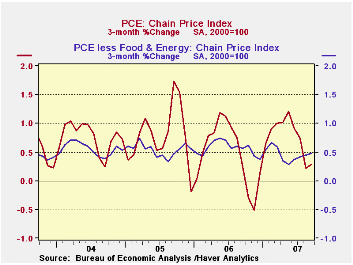
The PCE chain price index 0.2% (2.4% y/y). The core PCE price index was a bit firmer than in August with a 0.2% rise. The overall price index should firm with oil prices moving above $90 per barrel.
Can Social Security Survive the Baby Boomers? from the Federal reserve Bank of St. Louis can be found here.
The text which accompanied yesterday's FOMC decision to cut interest rates can be found here.
| Disposition of Personal Income | September | August | Y/Y | 2006 | 2005 | 2004 |
|---|---|---|---|---|---|---|
| Personal Income | 0.4% | 0.4% | 6.8% | 6.6% | 5.9% | 6.2% |
| Personal Consumption | 0.3% | 0.5% | 5.6% | 5.9% | 6.2% | 6.4% |
| Saving Rate | 0.9% | 0.8% | 0.4% (Sept. 06) | 0.4% | 0.5% | 2.1% |
| PCE Chain Price Index | 0.2% | -0.0% | 2.4% | 2.8% | 2.9% | 2.6% |
| Less food & energy | 0.2% | 0.1% | 1.8% | 2.2% | 2.2% | 2.1% |
Tom Moeller
AuthorMore in Author Profile »Prior to joining Haver Analytics in 2000, Mr. Moeller worked as the Economist at Chancellor Capital Management from 1985 to 1999. There, he developed comprehensive economic forecasts and interpreted economic data for equity and fixed income portfolio managers. Also at Chancellor, Mr. Moeller worked as an equity analyst and was responsible for researching and rating companies in the economically sensitive automobile and housing industries for investment in Chancellor’s equity portfolio. Prior to joining Chancellor, Mr. Moeller was an Economist at Citibank from 1979 to 1984. He also analyzed pricing behavior in the metals industry for the Council on Wage and Price Stability in Washington, D.C. In 1999, Mr. Moeller received the award for most accurate forecast from the Forecasters' Club of New York. From 1990 to 1992 he was President of the New York Association for Business Economists. Mr. Moeller earned an M.B.A. in Finance from Fordham University, where he graduated in 1987. He holds a Bachelor of Arts in Economics from George Washington University.


