 Global| Apr 30 2009
U.S. Personal Spending & Income Still Under Pressure
by:Tom Moeller
|in:Economy in Brief
Summary
Any recovery in consumer spending will have to wait. The U.S. Bureau of Economic Analysis reported that personal spending during March fell another 0.2% and adjusted for inflation spending also fell 0.2%. These declines followed two [...]
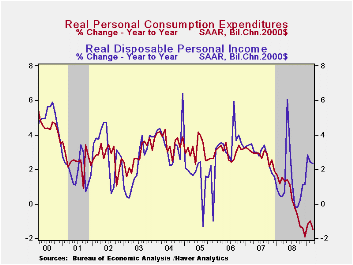
Any recovery in consumer spending will have to wait. The U.S. Bureau of Economic Analysis reported that personal spending during March fell another 0.2% and adjusted for inflation spending also fell 0.2%. These declines followed two months of increase but for all of the first quarter, real spending rose at just a 2.2% annual rate. That makes up little of the 4.3% decline during 4Q and the 3.8% 3Q drop.
Real spending on furniture & appliances last month retraced the gains of January & February with a 2.3% (-1.3% y/y) decline. Real spending on apparel also stuttered and fell 0.6%, reversing the February increase. Even real spending on services has been flat as it rose 0.1% last month after no change during February (+0.9% y/y). Any life in spending during March was limited to autos which rose 0.9%. That finished a quarter where spending made up half of the 4Q decline with a 4.8% increase.
The reason for the delay in a spending recovery is that income
remains under extreme pressure from the soft job market. The
0.3% decline in March personal income was the fifth shortfall in the
last six months and it fell short of expectations for a 0.2% decline.
In addition, disposable personal income was flat for
the second consecutive month. That followed the 1.6% jump which was the
result of a 10.5% monthly drop in taxes. Adjusted for inflation, real
disposable income also was flat last month after a 0.3% decline during
February. For the quarter, real take-home pay rose at a 6.2% annual
rate which was double the 4Q increase.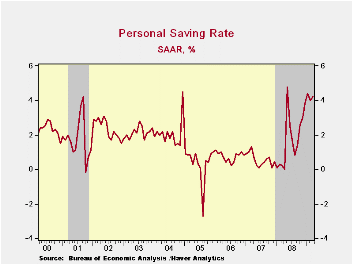
The good news from the latest report was that despite weaker income growth, lower spending has worked to lift the savings rate. The rise to 4.2% during March lifted the quarter's rate also to 4.2% which was its highest level since 1998.
Reflecting the weakness in the job market, wages & salaries fell another 0.5% (-1.2% y/y) and they have been flat or down in each of the last seven months. Over that period wages have fallen at a 3.2% annual rate, the quickest rate of decline since 1994. Private sector wages during that period were down at a 4.7% annual rate, still the worst since 1994. These declines contrast to wages in the government sector which continue to increase, at a 4.1% rate during the seven months.
Lower interest rates continued to pull interest income down,
by 0.6% during each of the last three months (-6.1% y/y). In addition
weak corporate profits lowered dividend income by 1.8%, about the
monthly rate of decline since October (-10.2% y/y).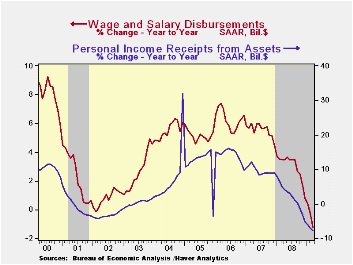
Finally, the PCE chain price index benefited from a 4.3% seasonally adjusted decline in gasoline prices (-37.7% y/y) and fell slightly. Core pricing power repeated the gains of the prior two months with a 0.2% increase that reflected a 1.5% increase in "other" nondurable goods prices. Most other goods and services prices were flat or down. The latest gain in the overall price deflator exceeded Consensus expectations for a 0.1% rise.
The personal income & consumption figures are available in Haver's USECON and USNA databases.
Ponds and Streams: Wealth and Income in the U.S., 1989 to 2007 from the Federal Reserve Board can be found here.
| Disposition of Personal Income (%) | March | February | Y/Y | 2008 | 2007 | 2006 |
|---|---|---|---|---|---|---|
| Personal Income | -0.3 | -0.2 | 0.3 | 3.8 | 6.1 | 7.1 |
| Disposable Personal Income | -0.0 | 0.0 | 3.0 | 4.6 | 5.5 | 6.4 |
| Personal Consumption Expenditures | -0.2 | 0.4 | -0.9 | 3.6 | 5.5 | 5.9 |
| Saving Rate | 4.2 | 4.0 | 0.2 (March '08) | 1.8 | 0.5 | 0.7 |
| PCE Chain Price Index | -0.0 | 0.3 | 0.6 | 3.3 | 2.6 | 2.8 |
| Less food & energy | 0.2 | 0.2 | 1.8 | 2.2 | 2.2 | 2.3 |
by Tom Moeller April 30, 2009
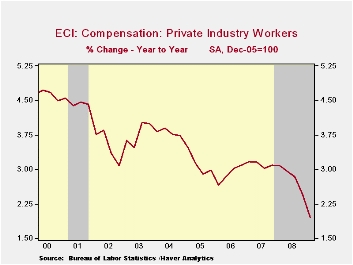
Weak job markets continue to hold down the increase in labor compensation. For private industry workers, the employment cost index increased by 0.2% last quarter which was less than half the 4Q gain. The gain fell well short of Consensus expectations for a 0.5% rise. The weakness in compensation is more apparent, however, in the 2.0% year-to-year increase which was the weakest in the series' history which dates back to 1981.
Compensation in manufacturing industries rose just 1.7% after
a 2.3% gain last year while a severe slowdown in growth was evident in
education & health services. The 2.9% increase compared to more
than 3% growth during the prior five years. Health care compensation
growth also slowed to 2.6%, its weakest on record. 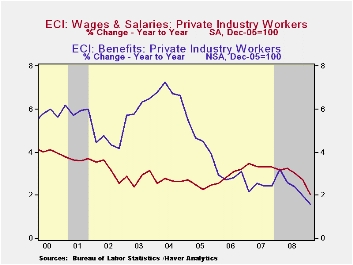
Wage and salary growth decelerated even further last quarter. The 0.2% gain pulled y/y growth down to just 2.0% which was its weakest on record. Wages account for roughly 70% of the compensation index. Wages in the services industries grew a not seasonally adjusted 0.5% and the y/y gain of 2.3% also was a record low. Wages in the goods producing industries inched up just 0.1% (2.1% y/y) and that y/y growth compares to a recent peak of 4.0% in 2000.
Slower growth in benefit costs continued to hold down overall compensation costs. The quarterly increase slowed to 0.2% after an upwardly revised gain of 0.4% during 4Q. The 1.5% year-to-year rise was a record low. In the goods producing sector benefits rose 1.3% y/y after a 2.2% increase during 2008 and in services they nudged up just 0.1% (1.7% y/y), a four quarter gain that was near the weakest on record.
Health benefit costs rose 4.6% y/y which was near the slowest rate of growth since 1999.
The employment cost index figures are available in Haver's USECON database.
| ECI - Private Industry Workers (%) | 1Q '09 | 4Q '08 | 1Q Y/Y | 2008 | 2007 | 2006 |
|---|---|---|---|---|---|---|
| Compensation | 0.2 | 0.5 | 2.0 | 2.8 | 3.1 | 2.9 |
| Wages & Salaries | 0.2 | 0.5 | 2.0 | 3.0 | 3.4 | 2.9 |
| Benefit Costs | 0.2 | 0.4 | 1.5 | 2.6 | 2.4 | 2.9 |
by Tom Moeller April 30, 2009
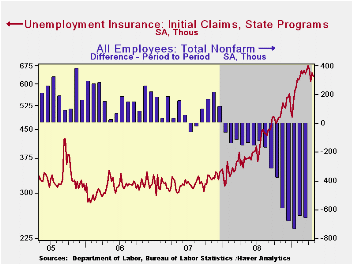
In what may be a sign that the worse for the U.S. job market
has passed, initial claims for unemployment insurance fell last week
and they have moved slightly lower since the March high. Claims fell to
631,000 from a little revised 645,000 during the prior period and the
April average of 637,000 is down from 658,000 during March. Despite the
modest improvement, claims remain near the ten-year high. The four-week
average of claims fell to 637,250, the lowest level since late February.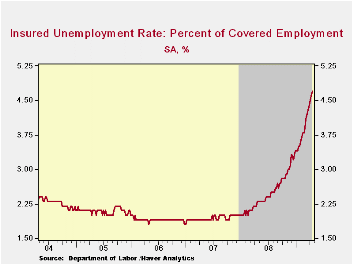
If the pace of worker layoffs has slowed, rehiring of unemployed workers has not picked up. Continuing claims for unemployment insurance increased to a record high of 6,271,000 are remain twice the year ago level. The series dates back to 1966. The four-week average of continuing claims also rose to another record of 6,076,000. Continuing claims provide some indication of workers' ability to find employment and they lag the initial claims figures by one week.
The Labor Department indicated that the largest increases in initial claims for the week ending April 18 were in California (+8,535), New York (+6,959), Connecticut (+3,086), Georgia (+3,056), and North Carolina (+2,983), while the largest decreases were in Pennsylvania (-7,799), Florida (-7,208), Illinois (-3,803), Ohio (-3,310), and Washington (-2,432).
Despite any marginal improvement in the job market, the insured rate of unemployment which follows the continuing claims figures rose yet again to 4.7%. That level was double last April and the highest level since 1983. During the last ten years there has been a 93% correlation between the level of the insured unemployment rate and the overall rate of unemployment published by the Bureau of Labor Statistics.Clearly, the latest weekly figure understates labor market distress in some states. The highest insured unemployment rates in the week ending April 11 were in Michigan (8.0 percent), Oregon (7.7), Pennsylvania (6.7), Wisconsin (6.7), Idaho (6.6), Nevada (6.3), Vermont (6.0), Rhode Island (5.9), Alaska (5.8), Illinois (5.7), and New Jersey (5.7).
The unemployment insurance claim data is available in Haver's WEEKLY database.
Do U.S. Consumers Really Benefit from Payment Card Rewards? from the Federal Reserve Bank of Kansas City is available here.
| Unemployment Insurance (000s) | 04/25/09 | 04/18/09 | 04/11/09 | Y/Y | 2008 | 2007 | 2006 |
|---|---|---|---|---|---|---|---|
| Initial Claims | 631 | 645 | 613 | 66.9% | 420 | 321 | 313 |
| Continuing Claims | -- | 6,271 | 6,138 | 107.4% | 3,342 | 2,552 | 2,459 |
by Robert Brusca April 30, 2009
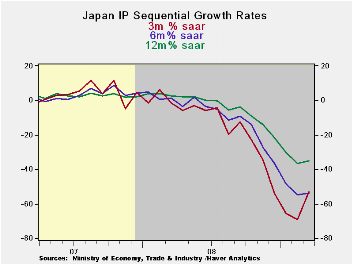
There is actually a bounce in output in Japan this month as
over MFG output rose by 1.6% in March. That bounce reduced the annual
rate of decline of Japan’s output to a pace of -53.1% over
three-months. So while the monthly gain seems impressive it is a gain
amid some pretty colossal losses.
Despite the gain in output this month, a gain that is fairly
widespread, all the sector three-month growth rates are showing an
accelerated rate of decline compared to six month rates (or nearly the
same pace). Even though the bounce is discernable on the chart above
tit has not been strong enough to stabilize any trends in output. Over
the past year output is down a stunning 35%. In the quarter output is
falling at a 63% annual rate.
Still the slight turn up in output at the end of the quarter
could be the start of turning these growth rates higher. The declines
are at such a horrific pace that even this small upturn will make it
likely that Q2 will show a slowing in the pace of the drop. Across
Europe and in the US signs that the pace of contraction is being
reduced are already more manifest than in Japan. Japan may be a
latecomer to this trend but the pickup in monthly IP, despite the fact
that data trends still swamp the gain, shows a significant boost that
could be the start of Japan’s turnaround.
| Japan Industrial Production Trends | ||||||||
|---|---|---|---|---|---|---|---|---|
| m/m % | Saar % | Yr/Yr | Qtr-2-Date | |||||
| seas adjusted | Mar-09 | Feb-09 | Jan-09 | 3-mo | 6-mo | 12-mo | Yr-Ago | % AR |
| mining & MFG | 1.6% | -9.4% | -10.1% | -53.1% | -53.6% | -35.1% | 2.5% | -63.3% |
| Total Industry | 1.3% | -9.1% | -9.3% | -51.5% | -52.3% | -34.0% | 2.5% | -61.6% |
| MFG | 1.7% | -9.2% | -10.3% | -52.8% | -53.4% | -35.0% | 2.7% | -63.3% |
| Textiles | -6.4% | -5.6% | -3.7% | -47.6% | -35.7% | -25.2% | -5.6% | -39.7% |
| T-port | 3.9% | -25.0% | -17.7% | -83.1% | -79.3% | -57.0% | 7.8% | -87.7% |
| Product Group | ||||||||
| Consumer Gds | 1.7% | -9.9% | -6.4% | -45.9% | -45.1% | -27.1% | 2.5% | -56.3% |
| Intermediate Gds | 3.2% | -9.3% | -12.8% | -55.6% | -59.8% | -40.0% | 3.9% | -70.1% |
| Investment Gds | -2.6% | -9.9% | -7.3% | -56.2% | -50.8% | -33.1% | -1.9% | -58.1% |
| Mining | -3.6% | -2.6% | -2.6% | -30.2% | -20.1% | -10.4% | -2.7% | -15.4% |
| Electric&Gas | -0.5% | -3.1% | -0.8% | -16.4% | -13.0% | -7.9% | 0.7% | -20.3% |

Tom Moeller
AuthorMore in Author Profile »Prior to joining Haver Analytics in 2000, Mr. Moeller worked as the Economist at Chancellor Capital Management from 1985 to 1999. There, he developed comprehensive economic forecasts and interpreted economic data for equity and fixed income portfolio managers. Also at Chancellor, Mr. Moeller worked as an equity analyst and was responsible for researching and rating companies in the economically sensitive automobile and housing industries for investment in Chancellor’s equity portfolio. Prior to joining Chancellor, Mr. Moeller was an Economist at Citibank from 1979 to 1984. He also analyzed pricing behavior in the metals industry for the Council on Wage and Price Stability in Washington, D.C. In 1999, Mr. Moeller received the award for most accurate forecast from the Forecasters' Club of New York. From 1990 to 1992 he was President of the New York Association for Business Economists. Mr. Moeller earned an M.B.A. in Finance from Fordham University, where he graduated in 1987. He holds a Bachelor of Arts in Economics from George Washington University.
More Economy in Brief


