 Global| Aug 28 2009
U.S. Personal Income Steadies in July after June Drop; PCE Shows First Effect of "Cash-for-Clunkers"
Summary
Personal income in July was almost exactly equalto June's amount, $11,957.4 billion versus $11,953.6 billion. While transfer payments and dividends decreased, this report includes the first increase in wages and salaries since last [...]
Personal income in July was almost exactly equalto June's amount, $11,957.4 billion versus $11,953.6 billion. While transfer payments and dividends decreased, this report includes the first increase in wages and salaries since last October, surely a welcome development, albeit a small one. Consensus forecasts were close to the actual, as they called for a 0.1% rise in total income.Transfers continued to fall in the wake of the stimulus-generated bulge in May, but the July decline was just 0.2%. Notably, this included a small decrease in unemployment benefits. The drop in dividends was 2.6%, larger than in May and June, but much less than the 4.9% average cut each month of Q1.
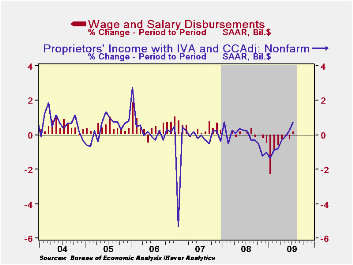
The wage and salary increases were small, just 0.1%, but this was evenly spread across goods producers, service producers and government workers. Another cyclically tied item, nonfarm proprietors' income, gained for a second month, rising in July by 0.8% after 0.3% in June. Prior to that, this small-business-owners' income had fallen for 10 consecutive months. 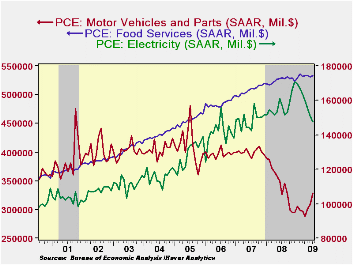
Taxes turned back higher as well last month, increasing 0.8%, their first increase since August 2008. Obviously, the pattern of stimulus-oriented refunds is impacting the monthly changes. More generally, taxes have recently been running at 9% of personal income, compared with 12.6% back at the peak of the economy and the first few months of recession in early 2008.
The steadier behavior of pre-tax incomes means that, despite the higher taxes in July, disposable personal income basically held at its June amount after a slightly revised 1.1% decline in June. Adjusted for inflation, real disposable income eased just 0.1%; it had fallen 1.6% in June. The saving rate decreased again, from June's 4.5% to 4.2%; obviously lower than the recent peak of 6.0% in May, it remains far higher than last July's 2.6% and compares favorably with almost the entire stretch of this decade so far.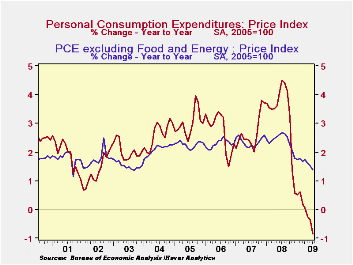
Consumer spending gained 0.2% in July after a 0.6% rise in June. Durable goods outlays were up 1.3%, as the initial weeks of the "cash-for-clunkers" program generated a surge of 22.3% in spending on new autos. [What will August's number show??]. Trucks benefited little from the program, but spending for them still went up 4.8%. Nondurable goods spending eased 0.3%, including a 2.2% drop in gasoline; recreation items, personal care products and household supplies also saw moderate decreases. Among services, total outlays increased 0.3%. This modest change masks some interesting moves individual items: spending on electricity was down 2% and has fallen in every month of 2009 so far. Transportation services were up 1.6%, but those related to personal motor vehicles increased just 0.3% while public transportation outlays gained 5.6%, with ground and air transport both participating. Finally, the comprehensive national accounts revisions have moved restaurants from nondurable goods to the service sector. Food services spending was up 0.4% in July, reversing June's 0.3% decline; the portion spent on "alcohol in purchased meals" gained 0.9%, however, its first increase in five months.
Pricing power remains basically nonexistent. The PCE chain price index was virtually flat last month, as energy prices decreased 0.4% after their surge in June. The ex-food-and-energy "core" was up a mere 0.1%, very close to its May and June amounts. Prices for services, long the most inflation-prone consumer items, increased just 0.1%, but this was largest one-month increase since last October.
The personal income & consumption figures are available in Haver's USECON and USNA databases.
| Disposition of Personal Income (%) | July | June | May | Y/Y | 2008 | 2007 |
|---|---|---|---|---|---|---|
| Personal Income | 0.0 | -1.1 | 1.4 | -2.4 | 2.9 | 5.6 |
| Disposable Personal Income | 0.0 | -1.1 | 1.7 | -0.3 | 3.9 | 4.9 |
| Personal Consumption Expenditures | 0.2 | 0.6 | 0.1 | -1.6 | 3.1 | 5.4 |
| Saving Rate | 4.2 | 4.5 | 6.0 | 2.6 (July '08) | 2.6 | 1.7 |
| PCE Chain Price Index | 0.0 | 0.5 | 0.1 | -0.8 | 3.3 | 2.7 |
| Less food & energy | 0.1 | 0.2 | 0.1 | 1.4 | 2.4 | 2.4 |
Carol Stone, CBE
AuthorMore in Author Profile »Carol Stone, CBE came to Haver Analytics in 2003 following more than 35 years as a financial market economist at major Wall Street financial institutions, most especially Merrill Lynch and Nomura Securities. She had broad experience in analysis and forecasting of flow-of-funds accounts, the federal budget and Federal Reserve operations. At Nomura Securities, among other duties, she developed various indicator forecasting tools and edited a daily global publication produced in London and New York for readers in Tokyo. At Haver Analytics, Carol was a member of the Research Department, aiding database managers with research and documentation efforts, as well as posting commentary on select economic reports. In addition, she conducted Ways-of-the-World, a blog on economic issues for an Episcopal-Church-affiliated website, The Geranium Farm. During her career, Carol served as an officer of the Money Marketeers and the Downtown Economists Club. She had a PhD from NYU's Stern School of Business. She lived in Brooklyn, New York, and had a weekend home on Long Island.
More Economy in Brief


