 Global| Jan 30 2006
U.S. Personal Income & Spending Firm
by:Tom Moeller
|in:Economy in Brief
Summary
Personal income rose an expected 0.4% last month following an upwardly revised like increase in November. For the full year personal income rose 5.4% which together with the 5.9% increase in 2004 was the strongest two year rise since [...]
Personal income rose an expected 0.4% last month following an upwardly revised like increase in November. For the full year personal income rose 5.4% which together with the 5.9% increase in 2004 was the strongest two year rise since 2001. The twelve month comparison of 2.1% suffered due to Microsoft's payment last year of a $32B stock dividend.
Wage & salary disbursements rose the same 0.3% (3.7% y/y) as during November and the full year gain of 6.0% was the strongest since 2000. Factory sector wages reversed the prior month's decline and rose 0.1% (2.4% y/y) while service sector wages rose a moderate 0.3% (3.7% y/y) following an upwardly revised 0.4% November increase.
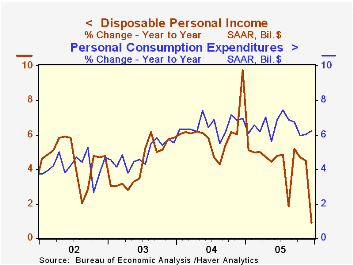
Disposable personal income rose 0.4% (0.9% y/y) for the second month. Adjusted for the negligible change in prices during December, take home pay jumped 0.4%, half the November increase which was boosted by a decline in prices and the year to year comparison was negative due to the dividend payout.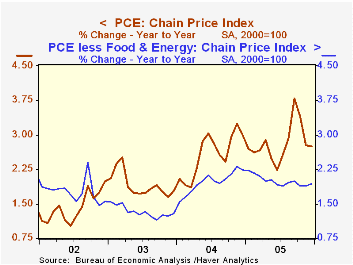
Personal consumption expenditures rose a firm 0.9% versus expectations for a 0.7% gain. Spending on motor vehicles & parts jumped 11.4% (-5.6% y/y) and spending on furniture & household equipment added 0.3% (6.4% y/y) to a 1.6% November spike. Spending on clothing & shoes dipped slightly (+5.8% y/y) following two months of huge increase while services spending rose 0.5% (6.3% y/y) after a 0.8% November jump.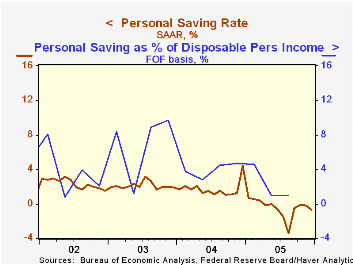
The PCE chain price index fell for the second consecutive month due to the third consecutive decline in gasoline & oil prices (+16.1% y/y). Less food & energy, prices rose 0.1% following an upwardly revised 0.2% November increase. Durables prices continued the most recent decline which began in May as furniture & household appliance prices fell (-4.0% y/y). Clothing & shoes prices also fell by 0.3% (-1.1% y/y) and services prices rose a modest 0.1% (3.3% y/y).
The personal savings rate was negative for the eighth month in the last nine. In comparison, the personal savings rate from the Federal Reserve's Flow of Funds accounts, through 3Q05, was similarly depressed but still a positive 0.9%. The Flow of Funds measure amortizes durable goods purchases over an expected lifetime instead of treating them as an expense.
The Income Implications of Rising U.S. International Liabilities from the Federal Reserve Bank of New York can be found here.
| Disposition of Personal Income | Dec | Nov | Y/Y | 2005 | 2004 | 2003 |
|---|---|---|---|---|---|---|
| Personal Income | 0.4% | 0.4% | 2.1% | 5.4% | 5.9% | 3.2% |
| Personal Consumption | 0.9% | 0.5% | 6.2% | 6.5% | 6.5% | 4.9% |
| Savings Rate | -0.7% | -0.2% | 4.4% (Dec '04) | -0.5% | 1.7% | 2.1% |
| PCE Chain Price Index | -0.0% | -0.4% | 2.8% | 2.8% | 2.6% | 1.9% |
| Less food & energy | 0.1% | 0.2% | 1.9% | 2.0% | 2.0% | 1.3% |
by Louise Curley January 30, 2006
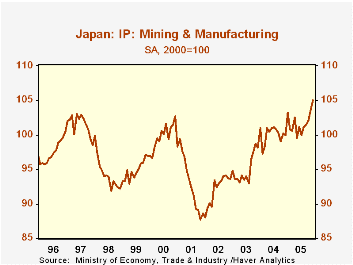
Industrial production in Japan rose for the fifth successive month in December giving further credence to Carol Stone's comment of last week: "So perhaps there is in fact room for encouragement about the state of the Japanese economy." The headline index of manufacturing and mining at 105.0 (2000=100) rose 1.4% in December and exceeded the previous peaks reached in 1997 and early 2001 as shown in the first chart.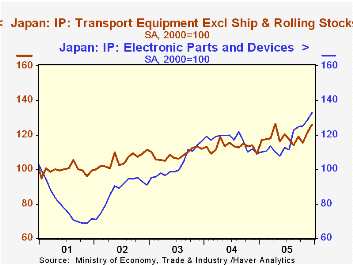
One of the fastest growing areas of Japanese manufacturing has been the Electronic Parts and Devices, followed closely by Transport Equipment (ex ships and rolling stock). These industries have shown strong growth trends throughout Japan's period of overall sluggish growth as shown in the second chart. In December, the Electronic Parts and Devices index was 32.8% above the 2000 average and 21.5% above December 2004. The Transport Equipment (ex ships and rolling stock) index was 26% above the 2000 average and 15.5% above December,2004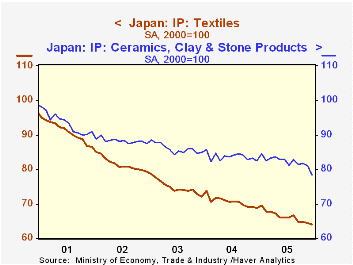
The rise of the Electronic and Transport Industries illustrates the changing structure of the Japanese economy. While these industries have grown, there has been a steady decline in the once traditional Japanese industries such as Textiles and Ceramics, Clay & Stone Products as shown in the third chart.
| Japan: Industrial Production (2000=100) | Dec 05 | Nov 05 | Dec 04 | M/M % | Y/Y % | 2005 | 2004 | 2003 |
|---|---|---|---|---|---|---|---|---|
| Manufacturing and Mining | 105.0 | 103.6 | 100.0 | 1.35 | 5.00 | 101.8 | 100.0 | 95.1 |
| Electronic parts and devices | 132.8 | 128.9 | 109.3 | 3.03 | 21.50 | 117.6 | 116.8 | 103.2 |
| Transport equip (ex ships and rolling stock) | 126.0 | 121.5 | 109.1 | 3.70 | 15.49 | 119.0 | 113.2 | 108.6 |
| Ceramics, clay and stone products | 78.5 | 81.0 | 82.5 | -3.09 | -4.85 | 82.2 | 83.6 | 86.0 |
| Textiles | 64.1 | 64.5 | 68.8 | -0.62 | -6.83 | 66.2 | 70.6 | 74.9 |

Tom Moeller
AuthorMore in Author Profile »Prior to joining Haver Analytics in 2000, Mr. Moeller worked as the Economist at Chancellor Capital Management from 1985 to 1999. There, he developed comprehensive economic forecasts and interpreted economic data for equity and fixed income portfolio managers. Also at Chancellor, Mr. Moeller worked as an equity analyst and was responsible for researching and rating companies in the economically sensitive automobile and housing industries for investment in Chancellor’s equity portfolio. Prior to joining Chancellor, Mr. Moeller was an Economist at Citibank from 1979 to 1984. He also analyzed pricing behavior in the metals industry for the Council on Wage and Price Stability in Washington, D.C. In 1999, Mr. Moeller received the award for most accurate forecast from the Forecasters' Club of New York. From 1990 to 1992 he was President of the New York Association for Business Economists. Mr. Moeller earned an M.B.A. in Finance from Fordham University, where he graduated in 1987. He holds a Bachelor of Arts in Economics from George Washington University.
More Economy in Brief


