 Global| Oct 30 2009
U.S. Personal Income Slips Marginally And Spending Declines
by:Tom Moeller
|in:Economy in Brief
Summary
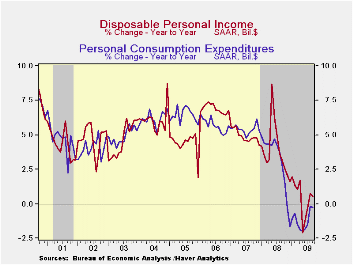
The weak job market continued last month to exact its toll on labor income growth. Personal income slipped marginally during September after two months of just 0.1% increase. The August gain was revised down from 0.2% and the latest [...]
 The weak job market continued last month to exact its toll on
labor income growth. Personal income slipped
marginally during September after two months of just 0.1% increase. The
August gain was revised down from 0.2% and the latest figure about
matched Consensus forecasts. These weak increases wholly reflect the
current recession. The good news, however, was that the worst
performance of early this year is over. On a three-month basis income
grew 0.2% during 3Q after a 0.4% 2Q gain. These figures compare to 2.6%
and 0.9% declines during 1Q and 4Q'08, respectively.
The weak job market continued last month to exact its toll on
labor income growth. Personal income slipped
marginally during September after two months of just 0.1% increase. The
August gain was revised down from 0.2% and the latest figure about
matched Consensus forecasts. These weak increases wholly reflect the
current recession. The good news, however, was that the worst
performance of early this year is over. On a three-month basis income
grew 0.2% during 3Q after a 0.4% 2Q gain. These figures compare to 2.6%
and 0.9% declines during 1Q and 4Q'08, respectively.
Job loss continued to account for recent weakness in income growth, but here again the recent numbers are "less bad." Wages & salaries fell 0.2% last month and reversed a 0.2% August increase. Year-to-year wages fell 5.2% after a 2.1% 2008 increase. Downward momentum, however, has eased. During the last three months, wages were roughly unchanged with the lessened rate of job loss reported in the monthly reports on payroll employment. Wages in the factory sector fell 0.2% following the 0.6% August drop. Yet, the three-month change fell to -0.1% from -2.7% and -6.9% during 2Q and 1Q. In the service sector wages slipped 0.1% last month but posted a modest increase during 3Q after declines during the prior three quarters. Offsetting this improvement has been a weaker government sector where wages ticked up just 0.4% during the last three months after 1.1% and 1.6% increases during the prior twp three-month periods.
 Even the growth in unemployment insurance payments slowed
recently. A 2.7% September decline was part of a 3Q slowing to 0.9%
growth from gains between 20%29 and 65% during each of the prior four
quarters. Interest income continued to show the effects of lower rates
and fell for the third straight month while dividend income fell by
one-quarter versus last year as corporate profits evaporated.
Even the growth in unemployment insurance payments slowed
recently. A 2.7% September decline was part of a 3Q slowing to 0.9%
growth from gains between 20%29 and 65% during each of the prior four
quarters. Interest income continued to show the effects of lower rates
and fell for the third straight month while dividend income fell by
one-quarter versus last year as corporate profits evaporated.
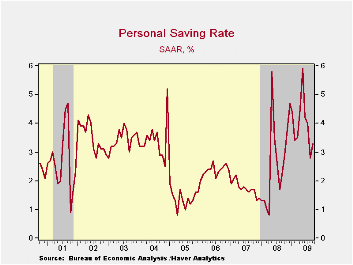
Disposable personal income fell slightly and reversed the August uptick. Adjusted for inflation, real disposable income fell for the fourth straight month after having been lifted this spring by tax cuts. The saving rate increased modestly m/m to 3.3% but remained down from the May peak of 5.9%. The rate remained up slightly from last year and double the 2007 level.
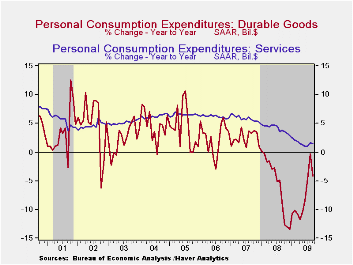
 Personal spending fell 0.5% after having
been lifted during August by the "cash for clunkers" program for new
motor vehicle purchases. Durables spending more-than reversed the
August rise with a 7.0% decline (-4.2% y/y). Spending on motor vehicles
fell 19.5% (-5.9% y/y) and reversed all of the August gain. Spending on
furniture rose a modest 0.4% (-4.7% y/y) and has risen slightly during
the last three months. Spending on nondurables rose 0.7% (-3.7% y/y) as
outlays on apparel rose for the third straight month (-1.7% y/y).
Outlays on services increased 0.2% (1.5% y/y) as spending on health
care continued quite strong and posted a 5.6% gain versus last year.
Spending in restaurants and on recreation remained negative.
Personal spending fell 0.5% after having
been lifted during August by the "cash for clunkers" program for new
motor vehicle purchases. Durables spending more-than reversed the
August rise with a 7.0% decline (-4.2% y/y). Spending on motor vehicles
fell 19.5% (-5.9% y/y) and reversed all of the August gain. Spending on
furniture rose a modest 0.4% (-4.7% y/y) and has risen slightly during
the last three months. Spending on nondurables rose 0.7% (-3.7% y/y) as
outlays on apparel rose for the third straight month (-1.7% y/y).
Outlays on services increased 0.2% (1.5% y/y) as spending on health
care continued quite strong and posted a 5.6% gain versus last year.
Spending in restaurants and on recreation remained negative.
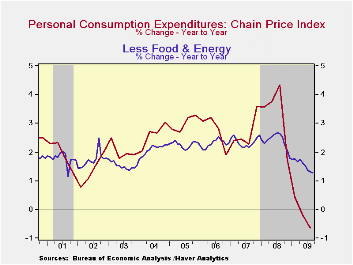
 Prices increased 0.1% during September reflecting an easier
1.2% rise (-29.8% y/y) rise in gasoline costs and another rise is in
store for October. Nevertheless, the PCE chain price index
still was down by 0.5% versus last year. Less food-and-energy, "core"
prices were again soft and posted their fifth consecutive 0.1%
increase. Goods prices rose 0.2% (-1.7% y/y) after two months of
decline while prices for services gained a steady 1.0% y/y.
Prices increased 0.1% during September reflecting an easier
1.2% rise (-29.8% y/y) rise in gasoline costs and another rise is in
store for October. Nevertheless, the PCE chain price index
still was down by 0.5% versus last year. Less food-and-energy, "core"
prices were again soft and posted their fifth consecutive 0.1%
increase. Goods prices rose 0.2% (-1.7% y/y) after two months of
decline while prices for services gained a steady 1.0% y/y.
The personal income & consumption figures are available in Haver's USECON and USNA databases.
Regulatory reform is the title of yesterday's speech by Fed Governor Daniel K. Tarullo and it can be found here.
| Disposition of Personal Income (%) | September | August | July | Y/Y | 2008 | 2007 |
|---|---|---|---|---|---|---|
| Personal Income | -0.0 | 0.1 | 0.1 | -2.8 | 2.9 | 5.6 |
| Disposable Personal Income | -0.0 | 0.1 | -0.1 | 0.5 | 3.9 | 4.9 |
| Personal Consumption Expenditures | -0.5 | 1.4 | 0.2 | -0.3 | 3.1 | 5.4 |
| Saving Rate | 3.3 | 2.8 | 4.0 | 2.2 (Sept. '08) | 2.6 | 1.7 |
| PCE Chain Price Index | 0.1 | 0.3 | 0.0 | -0.5 | 3.3 | 2.7 |
| Less food & energy | 0.1 | 0.1 | 0.1 | 1.3 | 2.4 | 2.4 |

Tom Moeller
AuthorMore in Author Profile »Prior to joining Haver Analytics in 2000, Mr. Moeller worked as the Economist at Chancellor Capital Management from 1985 to 1999. There, he developed comprehensive economic forecasts and interpreted economic data for equity and fixed income portfolio managers. Also at Chancellor, Mr. Moeller worked as an equity analyst and was responsible for researching and rating companies in the economically sensitive automobile and housing industries for investment in Chancellor’s equity portfolio. Prior to joining Chancellor, Mr. Moeller was an Economist at Citibank from 1979 to 1984. He also analyzed pricing behavior in the metals industry for the Council on Wage and Price Stability in Washington, D.C. In 1999, Mr. Moeller received the award for most accurate forecast from the Forecasters' Club of New York. From 1990 to 1992 he was President of the New York Association for Business Economists. Mr. Moeller earned an M.B.A. in Finance from Fordham University, where he graduated in 1987. He holds a Bachelor of Arts in Economics from George Washington University.
More Economy in Brief


