 Global| Nov 30 2007
U.S. Personal Income Light, Real DPI Down and Real PCE Easier
by:Tom Moeller
|in:Economy in Brief
Summary
Personal income during October rose 0.2% and the increase fell slightly short of Consensus forecasts for a 0.4% gain. The rise followed two months of 0.4% increased it lowered the three month growth in income to 4.3% (AR), its worst [...]
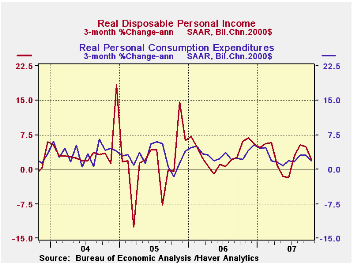
Personal income during October rose 0.2% and the increase fell slightly short of Consensus forecasts for a 0.4% gain. The rise followed two months of 0.4% increased it lowered the three month growth in income to 4.3% (AR), its worst since June.
A shortfall in wages & salaries accounted for much of October's easier income performance with a 0.1% (5.2% y/y) rise after a 0.6% September increase. Three month growth dipped to 4.1%, also the lowest since June. Factory sector wages fell 0.2% (+1.9% y/y) following downwardly revised gains in prior months.Wage & salary income in the private service-producing industries rose a slim 0.1% (6.1% y/y), also after downwardly revised earlier results, and wages in the government sector rose 0.4% (4.5% y/y).
Interest income grew just 0.1% (5.7% y/y) after a 0.6% September rise and dividend income popped another 0.9% (13.0% y/y).
Personal current taxes rose 0.5% (8.6% y/y). As a result, disposable personal income rose only 0.1% (5.7% y/y) but adjusted for inflation, disposable personal income fell 0.2% (+2.7% y/y) after a 0.2% September increase. That left the three month growth in real DPI at 2.1%, its lowest since June.
Personal consumption expenditures rose
0.2% in October and the gain matched expectations. Adjusted for
inflation spending fell very slightly m/m and the three month growth of
1.8% was its weakest since May.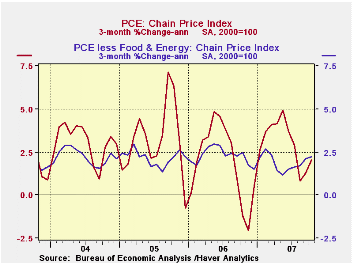
Spending on discretionary items seemed to ease as real spending on motor vehicles fell 0.9% (+2.7% y/y) and spending on household furniture & appliances dropped 0.3% (+7.4% y/y). Spending on apparel was unchanged (+4.2% y/y) and spending on recreation fell 0.3% (+2.5% y/y). These detailed spending figures are available in Haver's USNA database.
The PCE chain price index rose 0.3% and the y/y increase of 2.9% was its quickest since the middle of last year. The core PCE price index gained 0.2%, the same as in September. While y/y growth in core prices has been stable at 1.9%, a pickup to 2.3% (AR) over the last three months does not bode well for overall pricing pressure even given the recent easing of the upward march in oil prices.
Can Social Security Survive the Baby Boomers? from the Federal reserve Bank of St. Louis can be found here.
National and regional economic overview is yesterday's presentation by Fed ChairmanBen S. Bernanke and it is available here.
| Disposition of Personal Income | October | September | Y/Y | 2006 | 2005 | 2004 |
|---|---|---|---|---|---|---|
| Personal Income | 0.2% | 0.4% | 6.0% | 6.6% | 5.9% | 6.2% |
| Personal Consumption | 0.2% | 0.3% | 5.4% | 5.9% | 6.2% | 6.4% |
| Saving Rate | 0.5% | 0.7% | 0.4% (Oct. 06) | 0.4% | 0.5% | 2.1% |
| PCE Chain Price Index | 0.3% | 0.3% | 2.9% | 2.8% | 2.9% | 2.6% |
| Less food & energy | 0.2% | 0.2% | 1.9% | 2.2% | 2.2% | 2.1% |
by Tom Moeller November 30, 2007
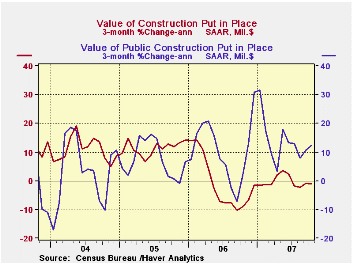
The value of construction put in place fell again October. The 0.8% decline followed a modest 0.2% uptick during September but the three month growth in activity has stabilized at -1.0% (AR), an improvement from the double digit rate of decline last Autumn.
Residential building dropped another 2.0% m/m and the three month change was -17.2% (AR), a stable rate of decline since the middle of last year. Building of new single family units, however, showed no sign of stabilizing or bottoming and produced a 4.0% (-26.4% y/y) fall m/m in October. To the upside, spending on improvements gained 0.7% (5.1% y/y) and the three month growth rate shot up to 23.5% (AR).
During the last twenty years there has been an 84% correlation between the q/q change in the value of residential building and its contribution to growth in real GDP.
Nonresidential building fell slightly for the first decline in
about one year. Three month growth remained stable, however, at a
positive 16.0% (AR). The 1.2% rise in office construction (20.3% y/y)
lifted three month growth to 44.7%, and multi-retail building activity
rose 1.6% (12.6% y/y). The shortfall in October nonresidential activity
was due partly to a modest 0.1% (11.8% y/y) uptick in commercial
construction which followed several months of little or negative
change. Also, the 1.8% (20.9 y/y) rise in educational facility building
followed two months of just slight increase.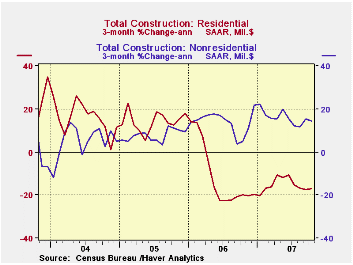
Strength in public construction spending was evident in a 0.8% October rise and the firm three month growth rate of 12.3% was stable. Construction on highways & streets rose 0.8% (9.2% y/y) after two months of double digit gain. The value of construction on highways & streets is nearly one third of the value of total public construction spending. Construction spending on education again was firm and grew 2.1% (18.2% y/y).
These more detailed categories represent the Census Bureau’s
reclassification of construction activity into end-use groups. Finer
detail is available for many of the categories; for instance,
commercial construction is shown for Automotive sales and parking
facilities, drugstores, building supply stores, and both commercial
warehouses and mini-storage facilities. Note that start dates vary for
some seasonally adjusted line items in 2000 and 2002 and that
constant-dollar data are no longer computed.
| October | September | Y/Y | 2006 | 2005 | 2004 | |
|---|---|---|---|---|---|---|
| Total | -0.8% | 0.2% | -0.6% | 5.6% | 10.7% | 11.0% |
| Private | -1.4% | -0.1% | -4.9% | 4.7% | 12.0% | 13.8% |
| Residential | -2.0% | -1.1% | -16.2% | 0.5% | 13.7% | 18.7% |
| Nonresidential | -0.5% | 1.5% | 17.5% | 15.2% | 7.8% | 3.8% |
| Public | 0.8% | 1.2% | 14.6% | 9.2% | 6.2% | 1.7% |
by Tom Moeller November 30, 2007
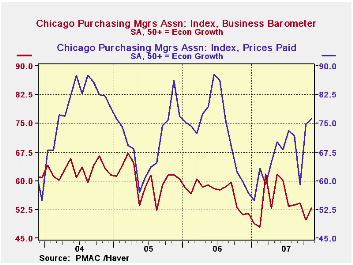
The Chicago Purchasing Manager's Association reported that its November business barometer improved to 52.9 and the 3.2 point rise from October reversed most of that month's deterioration. The latest figure was better than expected. Nevertheless, during the last four months the readings remained near or well below the highs of earlier this year.
During the last ten years there has been a 66% correlation between the index and the three-month change in US factory sector industrial production. There has been an 85% correlation between the Chicago figure and the national ISM index (due for release on Monday) and that is the highest correlation of all the regional series with the Nat'l index.
The production component of the Chicago measure gained back most of a sharp drop in October. New orders remained at the October level which was near the lowest since February. The employment index similarly rose but the gain followed three months of decline and the index was to nowhere near the high reached back in July.
The prices paid index rose sharply m/m to the highest level since July of 2006.
| Chicago PMI | November | October | Nov. '06 | 2006 | 2005 | 2004 |
|---|---|---|---|---|---|---|
| Chicago PMI Business Barometer Index | 52.9 | 49.7 | 51.2 | 56.8 | 60.4 | 62.8 |
by Robert Brusca November 30, 2007
Mixed but weakening, conditions. The
monthly EU sectors show that weakness still stalks the EU region. Still
some sectors have improved this month. The EU industrial index improved
in November to +3 from +2. The retail index improved from +2 to +4.
Despite that consumer confidence slipped to -7 from -5. The
construction sector also switched from being flat to a -1 reading. But
the largest drop was in services where the index fell to +14 from +19.
The services readings now stand only in the 52nd percentile of its
range. Retailing and construction are still in the 90th-something
percentiles of their respective ranges. The industrial sector is now in
its 88th percentile. But consumer confidence has slipped to the 69th
percentile. While there is some mixture in these figures it is clear
that the consumer is beset with concerns while the MFG sector has held
up. Construction, not having ever been very strong, give us a very high
positive range ranking on a raw reading of -1.
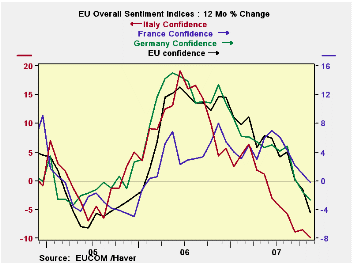
The good, the bad and the ugly. Across EMU
countries we find weaker conditions in general. The overall sentiment
is at a ranking of only the 71st percentile. France still ranks in its
81st percentile. Germany has slipped to its 64th. Italy and Spain hover
around the 50% mark for overall sentiment.
Risk of action…and inaction. On balance,
Europe is slipping but not yet doing poorly. But we know that exchange
rates work with a lag and there is more of that strong euro impact in
train. Also, that the recent inflation headline of 3% will send chills
up the spine of the ECB. Despite concerns of an overly strong EURO the
ECB with too-strong money and credit growth will have a hard time
balancing the things it wants to do (hike rates and fight inflation)
with the things it does not want to do (weaken already weakening growth
and spur an even stronger euro).
| EU Sectors and Country level Overall Sentiment | |||||||||||
|---|---|---|---|---|---|---|---|---|---|---|---|
| EU | Nov 07 |
Oct 07 |
Sep 07 |
Aug 07 |
%tile | Rank | Max | Min | Range | Mean | R-SQ w/ Overall |
| Overall | 107.6 | 109.6 | 110.6 | 113.1 | 78.5 | 62 | 117 | 74 | 43 | 100 | 1.00 |
| Industrial | 3 | 2 | 3 | 5 | 88.2 | 19 | 7 | -27 | 34 | -7 | 0.89 |
| Consumer Confidence | -7 | -5 | -4 | -3 | 69.0 | 60 | 2 | -27 | 29 | -10 | 0.82 |
| Retail | 4 | 2 | 1 | 6 | 92.6 | 7 | 6 | -21 | 27 | -6 | 0.47 |
| Construction | -1 | 0 | 1 | 0 | 91.1 | 17 | 3 | -42 | 45 | -18 | 0.44 |
| Services | 14 | 19 | 19 | 22 | 52.6 | 75 | 32 | -6 | 38 | 17 | 0.80 |
| % M/M | Based on Level |
Level | |||||||||
| EMU | -1.1% | -0.8% | -2.8% | -0.9% | 71.2 | 80 | 117 | 74 | 44 | 100 | 0.94 |
| Germany | 0.1% | -0.6% | -3.3% | -0.9% | 64.0 | 62 | 121 | 79 | 42 | 100 | 0.62 |
| France | -0.4% | 0.5% | -1.5% | -1.2% | 81.6 | 27 | 119 | 72 | 47 | 100 | 0.80 |
| Italy | -4.2% | -0.2% | -0.8% | -3.0% | 52.7 | 125 | 121 | 72 | 49 | 100 | 0.79 |
| Spain | -0.2% | -2.7% | -3.4% | 1.1% | 50.0 | 178 | 118 | 67 | 50 | 100 | 0.65 |
| Memo: UK | -4.4% | -2.0% | 1.1% | 4.5% | 78.2 | 60 | 119 | 69 | 50 | 101 | 0.40 |
| Since 1990 except Services(Oct 1996) | 208 | -Count | Services: | 126 | -Count | ||||||
| Sentiment is an index, sector readings are net balance diffusion measures | |||||||||||
by Robert Brusca November 30, 2007
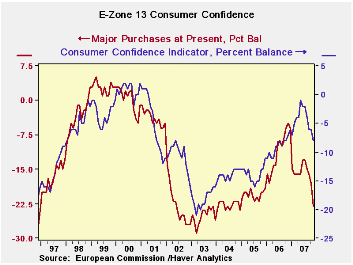
Consumer confidence is taking a hit and an ongoing one in EMU.
The percentiles tell an interesting story of these unfolding
developments. It is no surprise (final column of the table) that the
strongest correlation with Consumer Confidence is expected
unemployment. Expected unemployment is rising but is only in its 15th
percentile. Expected savings is also a very weak percentile reading as
is ‘major purchases now’. The later figure is plotted in the chart
along with the consumer confidence main index. ‘Major purchases now’
responses seem to lead the overall index -- and this series is very
weak.
The strongest range readings are for price trends (past 12
months and future 12 months) and for the ‘economic situation past 12
months’. In other words the more topical the categories, the weaker the
responses.
Across countries Germany’s responses are still quite strong in
the top 17 percent of its range. The UK in the 68th percentile is next
followed by France in the 60th percentile. Italy and Spain are weak
with readings below the 50th percentile.
It should not be a surprise that (apart from the UK) all these countries are in the same currency union and are experiencing the same pains of a strong currency. Germany, a county used to a strong currency, finds its consumers faring best. Italy and Spain, two previously weak currency countries, are having a much more difficult time making the adjustment to the strong euro.
| EMU Consumer Confidence and Country Performance | |||||||||||
|---|---|---|---|---|---|---|---|---|---|---|---|
| EMU | Nov 07 |
Oct 07 |
Sep 07 |
Aug 07 |
%tile | Rank | Max | Min | Range | Mean | R-SQ w/ Confid |
| Consumer Confidence | -8 | -6 | -6 | -4 | 67.7 | 67 | 2 | -29 | 31 | -12 | -- |
| Fin Situation Next 12 | -4 | -3 | -3 | -2 | 43.8 | 128 | 5 | -11 | 16 | -2 | 0.85 |
| Econ Sit Next 12 | -11 | -6 | -7 | -2 | 61.5 | 90 | 4 | -35 | 39 | -12 | 0.91 |
| Unemployment Expect | 7 | 5 | 6 | 3 | 15.9 | 183 | 60 | -3 | 63 | 26 | 0.94 |
| Savings Next 12m | -11 | -10 | -7 | -7 | 17.6 | 186 | 3 | -14 | 17 | -6 | 0.55 |
| Fin Sit Past12m | -13 | -12 | -10 | -10 | 36.8 | 121 | -1 | -20 | 19 | -11 | 0.53 |
| Econ Sit Past 12m | -17 | -14 | -13 | -9 | 69.6 | 54 | -3 | -49 | 46 | -24 | 0.87 |
| Savings-Now | 30 | 31 | 33 | 32 | 33.3 | 79 | 46 | 22 | 24 | 35 | 0.03 |
| Major Purchase-Now | -23 | -18 | -16 | -15 | 17.6 | 101 | 5 | -29 | 34 | -12 | 0.54 |
| Major Purchase Next 12m | -18 | -16 | -17 | -17 | 33.3 | 92 | -12 | -21 | 9 | -16 | 0.43 |
| Price trends past 12m | 55 | 50 | 45 | 41 | 88.1 | 9 | 63 | -4 | 67 | 31 | 0.10 |
| Price Trends Next 12m | 28 | 26 | 28 | 26 | 76.5 | 14 | 36 | 2 | 34 | 17 | 0.02 |
| By Country | |||||||||||
| Germany | 3 | 4 | 3 | 6 | 83.8 | 16 | 9 | -28 | 37 | -10 | 0.82 |
| France | -11 | -7 | -5 | -3 | 60.5 | 50 | 4 | -34 | 38 | -17 | 0.78 |
| Italy | -22 | -21 | -19 | -20 | 40.0 | 189 | 2 | -38 | 40 | -14 | 0.53 |
| Spain | -17 | -16 | -14 | -12 | 46.5 | 174 | 6 | -37 | 43 | -11 | 0.64 |
| UK | -4 | -2 | -3 | -2 | 68.6 | 75 | 7 | -28 | 35 | -7 | 0.21 |
| Since 1990 | 208 | -Count | |||||||||
by Robert Brusca November 30, 2007
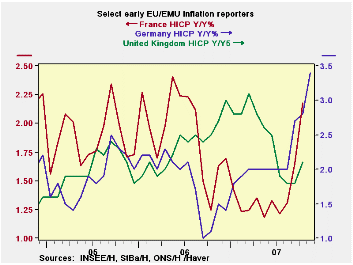
The monthly HICP has finally done it. It has moved up 3% and the ECB is stuck on the horns of a real dilemma. Prices are zooming up across the Euro area and most of it is oil. But 3% is a long way from 2%, the ECB’s oft stated limit for inflation. And the inflation rate shows a steady acceleration in recent months: a 5.8% rate over three months, 3.6% over 6 months 3% over 12 months… A year ago inflation was at 1.9% Yr/Yr. Now it is at 3% and pressing higher. Germany and Italy also with topical inflation reports available (Nov) show the same pattern and same ugly development.
If the ECB makes any more excuses it will look like that old three-stooges skit where the boys dare a muscle-bound bully to cross this line in the sand then keep redrawing it as he steps over it before they turn and run away. Nice image, eh?
Not only is inflation flaring on the headline but the core has been less than well behaved and money and credit growth have been excessive for so long that even the three stooges skit seems an inappropriate analogy by comparison.
The ECB has its back against a very uncomfortable wall and its bare feet on very hot tin roof. It is worried about second round inflation taking hold as first round inflation is stubbornly – and now chronically - well past its barrier. And Europe has the excessive liquidity to make that fear of second round effects real… but it also has the euro so strong that economic growth already is being undercut.
Welcome, Mr. Euro, to the realm of the reserve currency unit. This is exactly the sort of dilemma we have warned that Europe is not ready to face. And now it is front and center. The problem with being a reserve currency is that those hot little capital flows don’t always come when you want them. Those economic hot flashes can create trouble. Now Europe is on the brink of hiking rates and creating another episode of euro strength at a time it isn’t really needed or desired. The envelope please, Mr Trichet…
| Trends in HICP | |||||||
|---|---|---|---|---|---|---|---|
| % mo/mo | % saar | ||||||
| Nov-07 | Oct-07 | Sep-07 | 3-Mo | 6-Mo | 12-Mo | Yr Ago | |
| EU-13* | 0.6% | 0.4% | 0.4% | 5.8% | 3.6% | 3.0% | 1.9% |
| Core | #N/A | 0.3% | 0.2% | 3.0% | 2.2% | 2.1% | 1.6% |
| Goods | #N/A | 0.8% | 1.0% | 7.6% | 2.2% | 2.6% | 1.3% |
| Services | #N/A | 0.0% | -0.5% | -1.5% | 1.8% | 2.5% | 2.1% |
| *Monthly Flash data are derived from Yr/Yr presentation | |||||||
| HICP | |||||||
| Germany | 0.9% | 0.2% | 0.7% | 7.1% | 4.1% | 3.3% | 1.5% |
| France | #N/A | 0.2% | 0.1% | 2.6% | 2.3% | 2.1% | 1.2% |
| Italy | 0.2% | 0.7% | 0.3% | 4.7% | 3.1% | 2.4% | 2.1% |
| UK | #N/A | 0.5% | 0.1% | 2.7% | 1.5% | 2.0% | 2.5% |
| Spain | #N/A | 0.7% | 0.4% | 4.3% | 3.7% | 3.7% | 2.6% |
| Core:xFE&A | |||||||
| Germany | #N/A | 0.2% | 0.3% | 2.4% | 2.4% | 2.2% | 0.9% |
| France | #N/A | 0.2% | 0.1% | 2.7% | 1.9% | 1.7% | 1.3% |
| Italy | #N/A | 0.5% | 0.4% | 4.3% | 2.7% | 2.1% | 2.0% |
| UK | #N/A | 0.2% | 0.1% | 2.0% | 1.6% | 1.8% | 1.6% |
| Spain | #N/A | 0.7% | 0.2% | 4.8% | 3.5% | 3.1% | 2.8% |
| Blue shaded area data trail by one month | |||||||
by Robert Brusca November 30, 2007
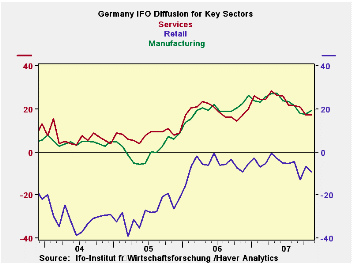
The IFO released its survey detail for its sector results previously announced for November. The IFO headlines are dropping steadily and consistently. Manufacturing, while showing some bounce in other recent surveys, is giving off strings of negative readings that reflect diminished growth from one year ago and fading prospects. In fact the IFO activity response is weaker Y/Yr for three months running. Demand is off for at least five months running. ‘Foreign orders on hand’ has been the slowest series to react but it is now down Yr/Yr for two months in a row.
The current situation is evaluated as steady for the last two months running. It remains in nearly the top 5% of the range for current situation historically. But business expectations continue to erode. They are still in the top one third of their range, but barely.
In the outlook for the next three months conditions are slipping. Retail orders expectations are erratically moving lower although this month interrupted a two month period of severe Yr/Yr drops. Wholesaling is however weakening rapidly and severely compared to its year ago levels. Export business expectations are consistently weaker than they were a year ago. Employment expectations continue to improve. Surely if the other trends are valid, that one can’t last.
| IFO Survey: Germany | ||||||||
|---|---|---|---|---|---|---|---|---|
| Percent: Yr/Yr | INDEX NUMBERS | |||||||
| Nov-07 | Oct-07 | Sep-07 | Aug-07 | Jul-07 | Current | Average | %tile | |
| Biz Climate | -2.5% | -1.5% | -0.9% | 0.7% | 0.8% | 104.2 | 95.8 | 81.0% |
| Current Situation | -3.1% | -2.1% | -1.3% | 2.5% | 2.4% | 110.4 | 94.9 | 84.8% |
| Biz Expectations: Next 6-Mos | -2.0% | -0.7% | -0.4% | -1.1% | -0.9% | 98.3 | 96.7 | 67.3% |
| Manufacturing: | Nov-07 | Oct-07 | Sep-07 | Aug-07 | Jul-07 | Current | Average | %tile |
| Current Situation | ||||||||
| MFG | 0.0% | 0.0% | 0.8% | 4.4% | 4.4% | 111.1 | 92.5 | 94.8% |
| Biz Expectations: Next 6-Mos | ||||||||
| MFG | -2.9% | -2.4% | -1.5% | -1.9% | -0.5% | 97.3 | 96.5 | 67.1% |
| Activity (m/m) | ||||||||
| MFG | -3.2% | -5.3% | -4.5% | 1.0% | -1.8% | 101.7 | 97.0 | 72.8% |
| Demand M/M | ||||||||
| MFG | -5.6% | -8.4% | -6.4% | -2.8% | -3.3% | 99.2 | 97.1 | 61.9% |
| Orders on hand | ||||||||
| MFG | -4.7% | -7.9% | -4.6% | -2.4% | -2.7% | 101.1 | 96.5 | 68.9% |
| Foreign orders on hand | ||||||||
| MFG | -1.9% | -0.4% | 0.5% | 2.5% | 2.0% | 109.7 | 94.7 | 91.7% |
| Yr/Yr percentage changes in underlying Indices | ||||||||
| IFO outlook for 3-Months ahead | ||||||||
| 3-Mos ahead | Percent: Yr/Yr | INDEX NUMBERS | ||||||
| Expected Activity | Nov-07 | Oct-07 | Sep-07 | Aug-07 | Jul-07 | Current | Average | %tile |
| MFG | -2.3% | -1.9% | -1.0% | 2.4% | 1.0% | 101.3 | 96.8 | 85.6% |
| Orders expectations | Changes over 12-months | |||||||
| Retail Orders | 4.0% | -12.0% | -8.0% | 3.0% | 4.0% | -8.8 | -17.7 | 76.8% |
| Wholesale | -10.0% | -12.0% | -13.0% | -5.0% | -5.0% | 5.5 | -13.8 | 80.2% |
| EXPORT Biz Expectations | ||||||||
| MFG | -3.3% | -3.8% | -2.4% | -0.1% | -0.9% | 103.1 | 98.5 | 87.7% |
| Employment Expectations | ||||||||
| MFG (Since June 1997) | 1.6% | 1.6% | 3.1% | 3.1% | 6.2% | 105.5 | 96.1 | 97.7% |

Tom Moeller
AuthorMore in Author Profile »Prior to joining Haver Analytics in 2000, Mr. Moeller worked as the Economist at Chancellor Capital Management from 1985 to 1999. There, he developed comprehensive economic forecasts and interpreted economic data for equity and fixed income portfolio managers. Also at Chancellor, Mr. Moeller worked as an equity analyst and was responsible for researching and rating companies in the economically sensitive automobile and housing industries for investment in Chancellor’s equity portfolio. Prior to joining Chancellor, Mr. Moeller was an Economist at Citibank from 1979 to 1984. He also analyzed pricing behavior in the metals industry for the Council on Wage and Price Stability in Washington, D.C. In 1999, Mr. Moeller received the award for most accurate forecast from the Forecasters' Club of New York. From 1990 to 1992 he was President of the New York Association for Business Economists. Mr. Moeller earned an M.B.A. in Finance from Fordham University, where he graduated in 1987. He holds a Bachelor of Arts in Economics from George Washington University.
More Economy in Brief


