 Global| Jun 30 2005
U.S. Personal Income Growth Eased in May
by:Tom Moeller
|in:Economy in Brief
Summary
May personal income rose just 0.2% following a downwardly revised 0.6% gain the prior month. Consensus expectations had been for a 0.3% increase. Wages & salaries rose a slim 0.1% (7.0% y/y) following the 0.7% pop in April. Wages in [...]
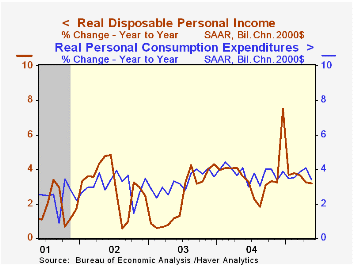
May personal income rose just 0.2% following a downwardly revised 0.6% gain the prior month. Consensus expectations had been for a 0.3% increase.
Wages & salaries rose a slim 0.1% (7.0% y/y) following the 0.7% pop in April. Wages in service producing industries rose 0.1% (8.3% y/y) after the 0.9% April gain but factory sector wages rose 0.3% (5.4% y/y) following a downwardly revised 0.4% April increase.
Disposable personal income rose 0.2% (5.5% y/y) following three months of 0.4% and 0.5% gain. When adjusted for price inflation take home pay rose 0.1% (3.2% y/y) for the second consecutive month.
Personal consumption was unchanged in May following a 0.6% increase in April due to the 4.5% m/m drop in light vehicle sales. Consensus expectations had been for a 0.1% rise. Spending on durables fell 1.8% (+3.7% y/y) and nondurables spending dipped 0.4% (+6.9% y/y) as gasoline prices fell. Spending on services rose 0.6% (5.6% y/y).
The PCE chain price index was unchanged with lower gas prices but less food & energy the 0.2% m/m increase was double the prior month's slim increase.
Lessons Learned from the Recent Business Cycle from Philadelphia Federal Reserve Bank President Santomero is available here.
| Disposition of Personal Income | May | April | Y/Y | 2004 | 2003 | 2002 |
|---|---|---|---|---|---|---|
| Personal Income | 0.2% | 0.6% | 6.7% | 5.8% | 3.2% | 1.8% |
| Personal Consumption | 0.0% | 0.6% | 5.7% | 6.0% | 5.2% | 4.6% |
| Savings Rate | 0.6% | 0.5% | 1.0% | 1.3% | 1.4% | 2.0% |
| PCE Chain Price Index | 0.0% | 0.4% | 2.2% | 2.2% | 1.9% | 1.4% |
| Less food & energy | 0.2% | 0.1% | 1.6% | 1.5% | 1.3% | 1.8% |
by Tom Moeller June 30, 2005
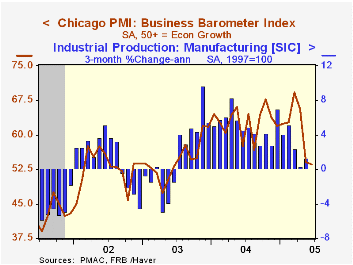
The Chicago Purchasing Managers Business Barometer fell again in June to 53.6, the lowest level in two years. Consensus expectations had been for a slight increase to 54.5.
During the last ten years there has been a 65% correlation between the level of Chicago PMI and the three month change in factory sector industrial production.
New orders fell for the third consecutive month and the employment index dropped to 48.9, below 50 for the first month since July of last year. During the last ten years there has been a 75% correlation between the level of the employment index and the three month change in factory sector employment.
The index of prices rose moderately. During the last ten years there has been an 86% correlation between the Chicago price index and the three month change in the "core" intermediate goods PPI.
| Chicago Purchasing Managers Index, SA | June | May | June '04 | 2004 | 2003 | 2002 |
|---|---|---|---|---|---|---|
| Business Barometer | 53.6 | 54.1 | 57.5 | 62.9 | 54.6 | 52.8 |
| New Orders | 56.5 | 57.9 | 58.3 | 67.0 | 58.0 | 56.2 |
| Prices Paid | 59.7 | 54.3 | 83.9 | 80.1 | 55.8 | 56.9 |
by Tom Moeller June 30, 2005

Initial claims for unemployment insurance dropped another 6,000 to 310,000 last week following a 19,000 decline the week prior that was revised slightly shallower. Consensus expectations had been for an increase to 325,000 claims.
During the last ten years there has been a (negative) 75% correlation between the level of initial claims for unemployment insurance and the monthly change in payroll employment. There has been a (negative) 65% correlation with the level of continuing claims.
The four week moving average of initial claims fell to 323,500 (-6.4% y/y).
Continuing claims for unemployment insurance rose a slight 4,000 following a deepened 42,000 drop the week prior.
The insured unemployment rate remained at 2.0%, the low for this cycle.
| Unemployment Insurance (000s) | 06/25/05 | 06/18/05 | Y/Y | 2004 | 2003 | 2002 |
|---|---|---|---|---|---|---|
| Initial Claims | 310 | 316 | -10.7% | 343 | 402 | 404 |
| Continuing Claims | -- | 2,600 | -11.7% | 2,926 | 3,531 | 3,570 |
by Tom Moeller June 30, 2005
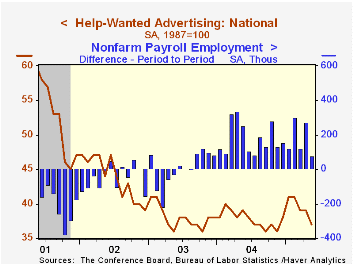
The Index of Help-Wanted Advertising from the Conference Board fell to 37 last month after two months at 39 and two months before that at 41.
During the last ten years there has been a 65% correlation between the level of help-wanted advertising and the three month change in non-farm payrolls.
The proportion of labor markets with rising want-ad volume rose modestly to a still low 39%.
The Conference Board surveys help-wanted advertising volume in 51 major newspapers across the country every month.
The latest help wanted report from the Conference Board is available here.
| Conference Board | May | April | May '04 |
|---|---|---|---|
| National Help Wanted Index | 37 | 39 | 39 |
by Tom Moeller June 30, 2005
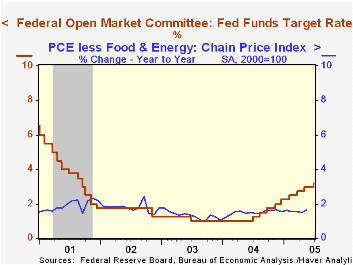
The Federal Open Market Committee increased interest rates for the ninth time since last June. The target rate for federal funds was raised an expected 25 basis points to 3.25% and the discount rate was raised 25 basis points to 4.25%.
The decision was unanimous.
Today's press release from the Fed continued to contain a comment suggesting that rates could be raised again. "The Committee believes that, even after this action, the stance of monetary policy remains accommodative ..."
For emphasis the statement indicated that "with appropriate monetary policy action, the upside and downside risks to the attainment of both sustainable growth and price stability should be kept roughly equal."
Discretion was indicated with the comment "the Committee will respond to changes in economic prospects as needed to fulfill its obligation to maintain price stability."
For the complete text of the Fed's latest press release please click here.
A Search for a Structural Phillips Curve from the Federal Reserve Bank of New York can be found here.
French Unemployment High, Consumer Confidence Low; Germany Sees Slight Declines in Unemploymentby Carol Stone June 30, 2005

Unemployment is creeping higher in France, with the unemployment rate for May holding at April's 10.2% of the labor force, according to INSEE's monthly labor force survey, released today. The rate there, defined according to the ILO specifications used throughout the Euro-Zone, has been on a upward trend since the slowdown in economic activity began in late 2000 (there has been no "official" recession in France as there was in the US).
INSEE also published its household confidence survey for June, which showed a continuing erosion in the overall indicator. The current reading, -30, is the lowest since survey questions were revised in November 2003. More people reported that their living standards had deteriorated during the last year, that this is a poor time to make make major purchases and that they expect to have difficulty saving over the next year. On the less worrisome side, interestingly, their concerns over unemployment prospects actually diminished. And that variable has only weak correlation with the unemployment rate itself. The overall index and the assessment of the household's current financial condition are much more closely related to the current unemployment rate, as seen in the graph. 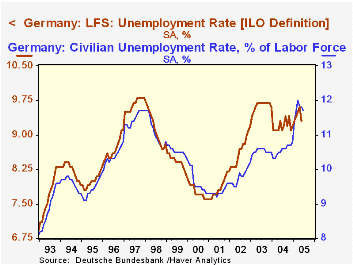
Germany's unemployment situation continues to make news, although the figures reported today for May and June actually look better. The ILO-defined rate fell 0.3 percentage point in May to 9.3%. This is not "low", but does give the impression that the climb in the rate that had begun in December may have run its course. "Registered" unemployment, the count of people registered with government unemployment offices, edged down in June to a rate of 11.7% from 11.8% in May; this rate peaked in March at 12.0%. Local observers, quoted in a Reuters news story, point out that the new "Hartz IV" regulations are starting to take effect, reducing unemployment benefits and requiring unemployed workers to accept new jobs more quickly. Thus, it is too early to conclude that these slight improvements in both unemployment rates mark a genuine firming of German economic activity. In fact, ever higher energy costs continue to cast a cloud on the economic outlook everywhere.
| June 2005 | May 2005 | Apr 2005 | Year Ago | 2004 | 2003 | 2002 | |
|---|---|---|---|---|---|---|---|
| France: Unemployment Rate (ILO, %) | -- | 10.2 | 10.2 | 10.0 | 10.0 | 9.8 | 9.1 |
| Household Confidence (%) | -30 | -29 | -24 | -23 | -22 | -27* | -16 |
| Germany: Employment (Change, Thous) | -- | -4 | 9 | 134 | 140 | -356 | -217 |
| Unemployment Rate (ILO, %) |
-- | 9.3 | 9.6 | 9.3 | 9.2 | 9.6 | 8.7 |
| Registered Unemployment Rate (%) | 11.7 | 11.8 | 11.8 | 10.6 | 10.6 | 10.5 | 9.8 |

Tom Moeller
AuthorMore in Author Profile »Prior to joining Haver Analytics in 2000, Mr. Moeller worked as the Economist at Chancellor Capital Management from 1985 to 1999. There, he developed comprehensive economic forecasts and interpreted economic data for equity and fixed income portfolio managers. Also at Chancellor, Mr. Moeller worked as an equity analyst and was responsible for researching and rating companies in the economically sensitive automobile and housing industries for investment in Chancellor’s equity portfolio. Prior to joining Chancellor, Mr. Moeller was an Economist at Citibank from 1979 to 1984. He also analyzed pricing behavior in the metals industry for the Council on Wage and Price Stability in Washington, D.C. In 1999, Mr. Moeller received the award for most accurate forecast from the Forecasters' Club of New York. From 1990 to 1992 he was President of the New York Association for Business Economists. Mr. Moeller earned an M.B.A. in Finance from Fordham University, where he graduated in 1987. He holds a Bachelor of Arts in Economics from George Washington University.
More Economy in Brief


