 Global| Mar 31 2006
U.S. Personal Income Gain Light
by:Tom Moeller
|in:Economy in Brief
Summary
Personal income rose 0.3% during February, a gain that fell just short of Consensus expectations for a 0.4% increase though the firm 0.7% January advance was unrevised. Wage & salary disbursements continued firm with a 0.4% (5.1% y/y) [...]
Personal income rose 0.3% during February, a gain that fell just short of Consensus expectations for a 0.4% increase though the firm 0.7% January advance was unrevised.
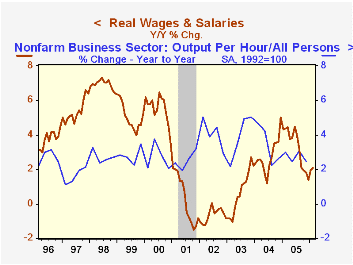
Wage & salary disbursements continued firm with a 0.4% (5.1% y/y) increase. Factory sector wages rose 0.2% (2.9% y/y) after an upwardly revised 0.3% January gain and the rise in service sector wages halved to 0.4% (5.4% y/y) after a 0.8% jump during January.Wages adjusted for price inflation during the last twelve months rose 2.1%, a deceleration from the 2005 advance. Last year, real wage growth of 3.3% just outpaced the 2.7% gain in worker productivity.
Disposable personal income increased 0.2% (5.1% y/y) after an upwardly revised 0.6% January increase. Adjusted for price inflation disposable income rose 0.2% (2.2% y/y). Real disposable income per capita increased 0.1% (1.3% y/y).Personal consumption rose 0.1%, a bit more than the Consensus expectation for no change. In real terms, a 2.1% (-4.6% y/y) drop in motor vehicles & parts held back the advance but spending on furniture & household equipment fell just 1.6% (+10.5% y/y) after a 4.4% January boom that was double the gain initially estimated. Spending on clothing & shoes gave back all of the downwardly revised January gain with a 1.1% (+4.1% y/y) decline. Real services spending rose 0.8% (3.0% y/y). Spending on household services & operation recovered 5.3% m/m as temperatures turned more normal.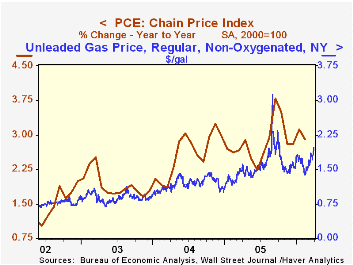
The PCE chain price index was unchanged as gasoline & oil prices fell 0.9% (21.4% y/y) though in March the wholesale price of gasoline has surged. Prices for clothing & shoes dropped 1.0% (-2.2% y/y) during February and furniture & household equipment prices fell another 0.3% (-4.2% y/y).
Incentives and Prices for Motor Vehicles: What has been happening in recent years? is a Working Paper from the Federal Reserve Board and is available here.
The personal savings rate was negative for the tenth month in the last eleven.
Temptation and Self-Control: Some Evidence and Applications from the Federal Reserve Bank of Minneapolis can be found here.
| Disposition of Personal Income | Feb | Jan | Y/Y | 2005 | 2004 | 2003 |
|---|---|---|---|---|---|---|
| Personal Income | 0.3% | 0.7% | 5.6% | 5.5% | 5.9% | 3.2% |
| Personal Consumption | 0.1% | 0.8% | 6.2% | 6.5% | 6.5% | 4.9% |
| Savings Rate | -0.5% | -0.5% | 0.5% (Feb '05) | -0.4% | 1.7% | 2.1% |
| PCE Chain Price Index | 0.0% | 0.5% | 2.9% | 2.8% | 2.6% | 1.9% |
| Less food & energy | 0.1% | 0.2% | 1.8% | 2.0% | 2.0% | 1.3% |
by Tom Moeller March 31, 2006
During late March, consumer sentiment recovered enough to lift the University of Michigan's Sentiment Index for the month to 88.9 from a preliminary indication of 86.7. Consensus expectations had been for a reading of 87.0.
During the last ten years there has been a 76% correlation between the level of consumer sentiment and the y/y change in real consumer spending.
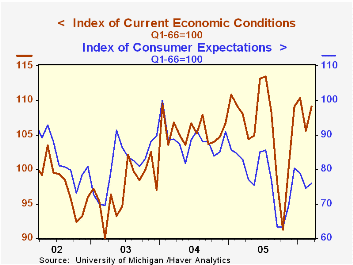
The current conditions index for the month improved 3.3% after a 4.3% decline during February. The index of personal finances recovered all of the prior month's drop with a 5.4% (+0.9% y/y) gain and the reading of buying conditions for large household goods rose 1.9% (1.2% y/y). Consumers' assessment of gov't economic policy improved late in the month enough to recover a piece of the sharp decline during February.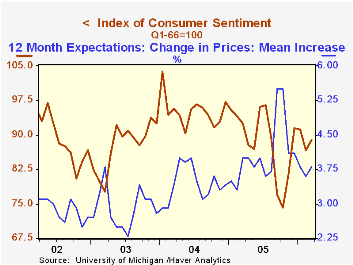
Consumer expectations rose 2.0% from February due to the late month improvement. The near term economic outlook still fell m/m but the long term outlook improved dramatically.
The mean expected inflation rate for the next twelve months rose m/m to 3.8%, still down from the 5.5% expected in October & September.
The University of Michigan survey is not seasonally adjusted.The mid-month survey is based on telephone interviews with 250 households nationwide on personal finances and business and buying conditions. The survey is expanded to a total of 500 interviews at month end.
Variations in consumer sentiment across demographic groups from the Federal Reserve Bank of Chicago is available here.
| University of Michigan | March | March (p) | Feb | Y/Y | 2005 | 2004 | 2003 |
|---|---|---|---|---|---|---|---|
| Consumer Sentiment | 88.9 | 86.7 | 86.7 | -4.0% | 88.6 | 95.2 | 87.6 |
| Current Conditions | 109.1 | 106.2 | 105.6 | 1.0% | 105.9 | 105.6 | 97.2 |
| Expectations | 76.0 | 74.2 | 74.5 | -8.2% | 77.4 | 88.5 | 81.4 |
by Tom Moeller March 31, 2006
Factory inventories dropped 0.4% last month. This first decline since August of last year followed 1.1% accumulation during January, that was twice the 0.5% gain initially estimated.
Motor vehicle & parts inventories dropped 0.4% (-3.3% y/y), the third consecutive monthly decline. Nondefense aircraft inventories also were off 1.5% (+2.2% y/y). Less transportation altogether factory inventories fell 0.2% (+3.4% y/y) after a 1.2% jump during January.
Primary metals inventories jumped 1.2% (2.9% y/y) but machinery inventories fell 0.1% (+5.2% y/y and electrical equipment fell 0.2% (+6.7% y/y). These latter two declines followed huge increases during January.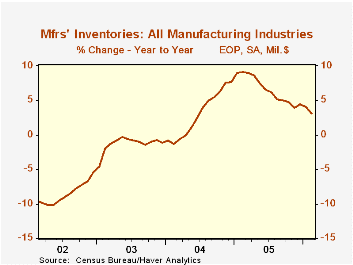
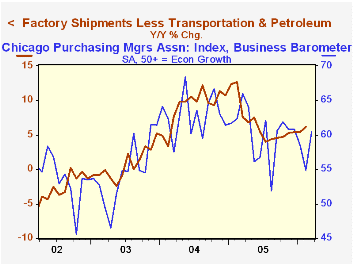
Total factory orders gained back 0.2% of January's 3.9% skid. Durable goods orders gained 2.7%, little revised from the advance report. Factory orders less the transportation sector altogether fell 2.0% (+6.2% y/y) and that wholly reversed the gain during January.
Factory shipments fell 1.1% and less transportation shipments fell an even greater 1.3% (7.2% y/y). The total was dragged down by an 11.8% (+19.7% y/y) drop in shipments of petroleum. Factory shipments less transportation and petroleum slipped 0.1% (+6.2% y/y) after a 1.1% surge during January.
Unfilled orders rose 0.9% but the 0.2% January decline was shallower than originally estimated. Less the transportation sector, backlogs rose 0.4% (10.0% y/y) and the 0.6% January increase was upwardly revised.
| Factory Survey (NAICS) | Feb | Jan | Y/Y | 2005 | 2004 | 2003 |
|---|---|---|---|---|---|---|
| Inventories | -0.4% | 1.1% | 3.2% | 4.4% | 7.7% | -1.1% |
| New Orders | 0.2% | -3.9% | 7.2% | 8.5% | 9.3% | 3.5% |
| Shipments | -1.1% | 0.1% | 7.1% | 7.4% | 9.5% | 1.5% |
| Unfilled Orders | 0.9% | -0.2% | 17.0% | 16.5% | 8.4% | 8.0% |
by Carol Stone March 31, 2006
We've written about Japan frequently here the last few weeks, and candidly, we make no apology for appearing to be single-minded. Economists, practitioners of "the dismal science", rarely, it seems, have the opportunity to discuss genuinely pleasing developments. So on a day at the end of the Japanese fiscal year, when we can talk about sizable gains in employment, the largest one-month drop in the unemployment rate ever and continuing modest inflation in Japan, we're going to do it, even if it's just been a few days since we commented on rising land prices, another positive sign.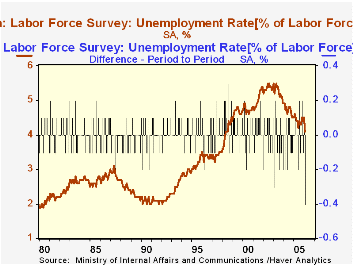
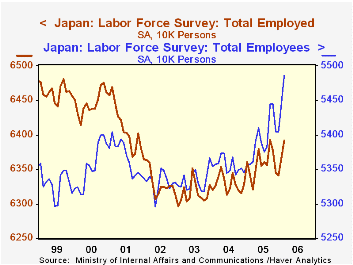
The labor force survey for February shows a 240,000 increase the number of people employed; this follows 270,000 in January, making more than half-a-million new workers since the beginning of calendar 2006. Employment in Japan has actually been ratcheting modestly higher since sometime in 2003, but these recent gains pick up the pace significantly. February's total, at 63.92 million workers, was up 0.8% from a year ago, nearly twice the relative increase for all of 2005. Moreover, the number of "employees" has increased more; people who work for companies are up 82,000 cumulatively in January and February and the number of people otherwise employed fell by 310,000 in the same two months to just barely over 9 million. When economies are weak, many people who are unable to find jobs elsewhere, start their own business or go to work in the family store. But as the economy strengthens, they can find more jobs at companies; this is happening in Japan and the percentage drop in the number of independent workers from a year ago was the steepest ever in January and February.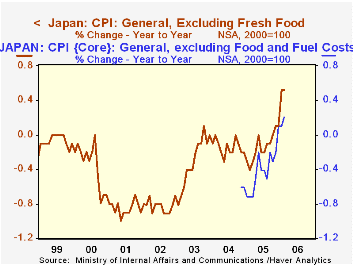
Another decline that was the biggest ever was that in the unemployment rate, 0.4%, from January to February. This was due, of course, to the increase in employment, but also to only a minimal increase in the total labor force. Even so, the labor force appears to be growing now, albeit modestly and irregularly. The slim 80,000 advance in 2005 was the first yearly increase since 1998. Renewed gains here are also a sign of a better outlook among workers; those unemployed were apparently withdrawing from the labor force, but now they are "available for work", perhaps with hopes raised that a job might be forthcoming.
Finally, we can't let the CPI go without brief mention. The increases remain quite small, but they are there nonetheless. The most widely watched line item is the "general index excluding fresh food". It has shown a year-to-year increase now for four months. Some of the rise is due to higher energy prices, but a new version of a core index excluding energy was also up in February, by 0.2% from a year earlier. Clothing, "miscellaneous" (including personal care), and housing costs are all rising.
| Feb 2006 | Jan 2006 | Dec 2005 | Year Ago | 2005 | 2004 | 2003 | |
|---|---|---|---|---|---|---|---|
| Employment (SA, mil) | 63.92 | 63.68 | 63.41 | 63.43 | 63.56 | 63.29 | 63.16 |
| Change (thous)/% Change | +240 | +270 | -40 | 0.8 | 0.4 | 0.2 | -0.2 |
| Unemployment Rate (SA, %) | 4.1 | 4.5 | 4.4 | 4.6 | 4.4 | 4.7 | 5.3 |
| Monthly Change | -0.4 | +0.1 | -0.1 | -- | -- | -- | -- |
| CPI: General(NSA,yr/yr % chg) | 0.4 | 0.5 | -0.1 | -- | -0.3 | -0.0 | -0.3 |
| CPI: General ex Fresh Food (NSA, yr/yr % chg) | 0.5 | 0.5 | 0.1 | -- | -0.1 | -0.1 | -0.3 |

Tom Moeller
AuthorMore in Author Profile »Prior to joining Haver Analytics in 2000, Mr. Moeller worked as the Economist at Chancellor Capital Management from 1985 to 1999. There, he developed comprehensive economic forecasts and interpreted economic data for equity and fixed income portfolio managers. Also at Chancellor, Mr. Moeller worked as an equity analyst and was responsible for researching and rating companies in the economically sensitive automobile and housing industries for investment in Chancellor’s equity portfolio. Prior to joining Chancellor, Mr. Moeller was an Economist at Citibank from 1979 to 1984. He also analyzed pricing behavior in the metals industry for the Council on Wage and Price Stability in Washington, D.C. In 1999, Mr. Moeller received the award for most accurate forecast from the Forecasters' Club of New York. From 1990 to 1992 he was President of the New York Association for Business Economists. Mr. Moeller earned an M.B.A. in Finance from Fordham University, where he graduated in 1987. He holds a Bachelor of Arts in Economics from George Washington University.
More Economy in Brief


