 Global| Jan 31 2008
U.S. Personal Income Firm, Spending Light
by:Tom Moeller
|in:Economy in Brief
Summary
Personal income slightly beat Consensus expectations last month with a 0.5% rise. Three- month growth in income totaled 4.4% (AR), a growth rate that has been roughly steady. Wage & salary income rose 0.4% (4.8% y/y) after a 0.6% [...]
Personal income slightly beat Consensus expectations last month with a 0.5% rise. Three- month growth in income totaled 4.4% (AR), a growth rate that has been roughly steady.
Wage & salary income rose 0.4% (4.8% y/y) after a 0.6% November rise. Three- month growth amounted to 4.1% which has been a roughly steady rate of growth. Factory sector wages, however, fell 0.3% (+0.9% y/y) after rising 0.3% during the prior month.Wage & salary income in the private service-providing industries rose 0.5% (5.8% y/y). Wages in the government sector again increased 0.3% (4.8% y/y).
Lower interest rates caused the third straight 0.3% decline in
interest income (+6.7% y/y). Dividend income held steady at 0.9% (12.4%
y/y).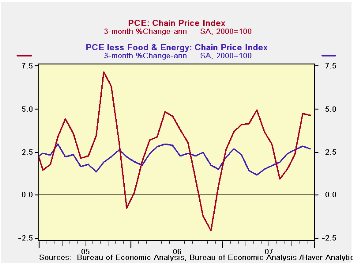
Personal current taxes rose 0.5% (7.1% y/y. That y/y growth rate is less than one half the rate of rise during 2005. That left disposable personal income to rise 0.5% (5.6% y/y). Adjusted for inflation, disposable personal income increased 0.2% (2.1% y/y). The three- month growth in remained negative at -0.5%.
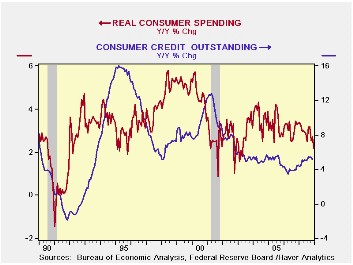
Personal consumption expenditures rose a hair more than the Consensus expectation for a 0.1% uptick. The 0.2% rise, however, left spending real spending during December down slightly and the three-month growth rate fell to 1.3%, its lowest since July.
Spending on discretionary items slipped as real spending on autos (-0.4% y/y) fell for the third straight month. Growth in real spending on household furniture & appliances also fell back to 0.1% (7.1 y/y) after a 1.5% pop in November. Spending on apparel, however, was quite weak and fell 2.0% (+1.8% y/y). Medical care spending rose 0.3% (2.8% y/y. The detailed spending figures are available in Haver's USNA database.
The PCE chain price index rose 0.2% after the 0.6 surge during November. The gain in the core PCE price index held steady for the third month at 0.2%. However, the three- month growth in core prices recently has been far from steady, rising to 2.7% from its low in May due to faster growth in services prices.
IMF Sees World Growth Slowing, With U.S. Marked Down from the International Monetary Fund can be found here.
| Disposition of Personal Income | December | November | Y/Y | 2007 | 2006 | 2005 |
|---|---|---|---|---|---|---|
| Personal Income | 0.5% | 0.4% | 5.8% | 6.2% | 6.6% | 5.9% |
| Personal Consumption | 0.2% | 1.0% | 5.7% | 5.5% | 5.9% | 6.2% |
| Saving Rate | 0.2% | 0.0% | 0.3% (Dec. 06) | 0.5% | 0.4% | 0.5% |
| PCE Chain Price Index | 0.2% | 0.6% | 3.5% | 2.5% | 2.8% | 2.9% |
| Less food & energy | 0.2% | 0.2% | 2.2% | 2.1% | 2.2% | 2.2% |
by Tom Moeller January 31, 2008
Rising 0.8% last quarter, the employment cost index for private industry workers remained steady with the 3Q increase. The gain matched Consensus expectations. Moreover, the gain in total compensation in 4Q was roughly steady at 3.0% with the gains since 2005.
During the last twenty years there has been a 54% correlation
between the growth in employee compensation and the rise in the PCE
price index. That level of correlation goes neither up or down, when
either series is led or lagged the other. This suggests a self
reinforcing effect between the two series.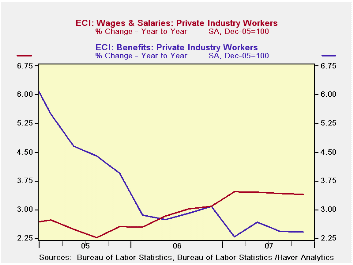
Wage and salary growth held at the 0.8% rate of 3Q. Wages account for roughly 70% of the compensation index. Wages in the services industries rose 0.8% (3.3% y/y). Wages in the leisure & hospitality sector have been relatively strong with a 4.2% rise and professional & business services wages also have been strong with a 4.0% y/y gain. Wages in the goods producing industries rose 0.9% (2.5% y/y) have lagged.
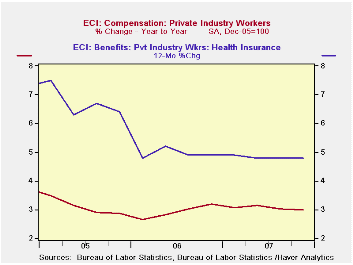
The gain in benefit costs also held about steady with a 0.9% 4Q rise. For all of last year, the 2.4% growth rate was the lowest since 1997. The slowdown has been pronounced in most service industries, but perhaps most pronounced in the goods producing sector where a 1.4% y/y growth rate last year is down from 8.7% growth in 2004.
The slowdown in benefit cost inflation for the year is due in
part to a more moderate rise in the cost of health benefits:up 4.8%
last year versus 10%+ rates of gain in 2002 and 2003.
| ECI- Private Industry Workers | 4Q '07 | 3Q '07 | 2Q '07 | 4Q Y/Y | 2007 | 2006 | 2005 |
|---|---|---|---|---|---|---|---|
| Compensation | 0.8% | 0.8% | 0.9% | 3.0% | 3.1% | 2.9% | 3.1% |
| Wages & Salaries | 0.8% | 0.8% | 0.8% | 3.4% | 3.4% | 2.9% | 2.5% |
| Benefit Costs | 0.9% | 0.8% | 1.1% | 2.4% | 2.4% | 2.9% | 4.6% |
by Tom Moeller January 31, 2008
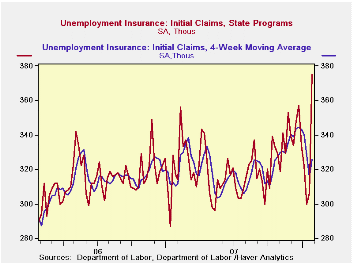
Last week, initial claims for jobless insurance surged to a
level which now exceeds the late 2007 highs. A 69,000 w/w jump to
375,000 followed declines during the prior several weeks. The latest
level is the highest since October of 2005. The difficulties of
seasonal adjusting the data during the holiday season clearly played a
role in the earlier declines. A more modest rise in claims to 317,000
had been generally expected.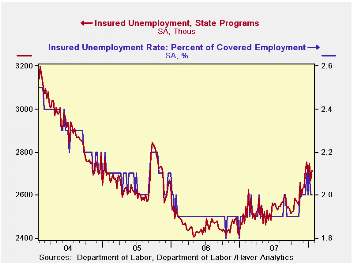
The four- week moving average of initial claims, a measure which smoothes out most of the series' w/w volatility, rose to 325,750 (+5.0% y/y).
A claims level below 400,000 typically has been associated with growth in nonfarm payrolls. During the last six years there has been a (negative) 78% correlation between the level of initial claims and the m/m change in nonfarm payroll employment.
Continuing claims for unemployment insurance rose 47,000 after a little revised 78,000 decline during the week prior. The figure provides some indication of workers' ability to find employment but here again difficulties of seasonal adjustment this time of year are great.
The continuing claims numbers lag the initial claims figures by one week.
The insured rate of unemployment held steady w/w at 2.0%.
Credit Derivatives, Macro Risks, and Systemic Risks from the Federal Reserve Bank of Atlanta can be found here.
| Unemployment Insurance (000s) | 01/26/08 | 01/19/07 | Y/Y | 2006 | 2005 | 2004 |
|---|---|---|---|---|---|---|
| Initial Claims | 375 | 306 | 18.3% | 313 | 331 | 343 |
| Continuing Claims | -- | 2,716 | 8.1% | 2,459 | 2,662 | 2,924 |
by Tom Moeller January 31, 2008
The Conference Board indicated that its index of help-wanted advertising did rise slightly last month but only to 22 from 21 in November. The figures are at the record lows for the series which dates back to the 1950s.
The Conference Board surveys help-wanted advertising volume in 51 major newspapers across the country every month.
During the last ten years there has been a 57% correlation
between the level of help-wanted advertising and the three month change
in non-farm payrolls.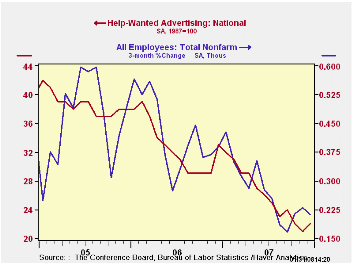
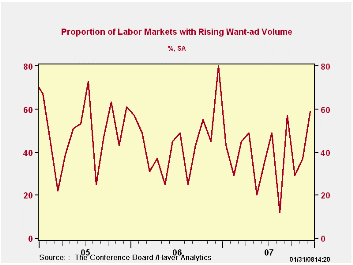
The proportion of labor markets with rising want-ads improved to 59% from a low of 12% in August.
The regions of the country where the index of help-wanted advertising improved m/m were the West South Central, the West North Central, the East North Central, and the Middle Atlantic. States in each of the other regions of the country showed flat or declining ad volume.
The latest help wanted report from the Conference Board is available here.
| Conference Board | December | November | December 2006 | 2007 | 2006 | 2005 |
|---|---|---|---|---|---|---|
| National Help Wanted Index | 22 | 21 | 33 | 26 | 33 | 39 |
by Robert Brusca January 31, 2008
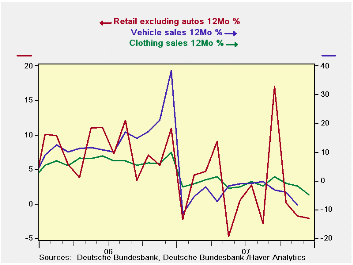
German retail sales in December did nothing to make large piles of presents appear under the old tanenbaum. Retail sales ex autos, German clothing sales and vehicle sales (that lag for now) each shows a dwindling trend. In the fourth quarter, nominal ex auto sales are lower at a 7.4% annual rate; in real terms that becomes a -11.4% annual rate.
The German unemployment rate continues to drop but German unemployment still hovers above 8%. Despite ongoing e-Zone improvements the consumer remains a lagging sector and now creeping evidence shows a slowing across the e-Zone itself. Consumer confidence and retailing continue to be the lagging sectors that optimists look to become sources of growth as the Germany economy shifts into its next gear. The problem is that various consumer measures suggest that no such pick-up lies ahead for the consumer sentiment or for consumer spending. Strength in the euro, while a source of contentment to the ECB - and many Germans as well - is also a source of angst for what it means to German export prospects.
With the release of the EU Commission indexes today the German economy showed a drop to -1 in sentiment for the consumer sector in January. Retailing, too, saw sentiment fall back from a -18 rating in December to -22 in January. Germany’s industrial sector, the back bone of the economy, stepped back to post a +1 reading from +2 in December. The services and construction sectors (the latter still very weak) each posted month-to-month improvements. But by and large German sectors took a step back in January with Germany’s overall sentiment reading falling by two full points. The consumer sector does not seem about to get out of its rough patch at all.
| German Real and Nominal Retail Sales | ||||||||
|---|---|---|---|---|---|---|---|---|
| Nominal | Dec-07 | Nov-07 | Oct-07 | 3-Mo | 6-Mo | 12-Mo | Year Ago | SAAR (QTR) |
| Retail Ex Auto | -0.4% | -1.1% | -1.4% | -11.0% | -4.0% | -4.9% | 9.8% | -7.4% |
| Motor Vehicle and Parts | -- | -1.2% | 0.4% | -- | -- | -- | 38.2% | -- |
| Food Beverages & Tobacco | -1.4% | -2.3% | 0.1% | -13.5% | -5.3% | -3.3% | 5.7% | -4.5% |
| Clothing Footwear | 2.3% | -1.5% | -8.5% | -27.8% | -3.7% | -2.1% | 10.9% | -18.8% |
| Real | ||||||||
| Retail Ex Auto | -0.1% | -1.9% | -1.8% | -14.3% | -6.9% | -6.8% | 9.4% | -11.4% |
by Robert Brusca January 31, 2008
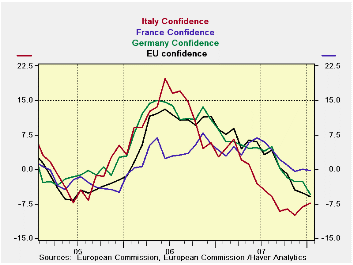
At 103.2, the EU confidence index fell by two points following
a nearly one point drop in December. The sentiment index now resides at
the border of the 70th percentile of its range since 1990. In absolute
terms services and the industrial sector give the most lift to the
region. But once alternatively ranked within their own ranges (since
1990) the sectors are repositioned. The industrial sector becomes the
strongest residing in the 85th percentile of its range with
construction, a battered sector, still doing ‘relatively’ well in the
84th percentile of its range. While the service sector has a high raw
score, that is simply the nature of trend-dominated services. When
placed within its range, its relative contribution is much diminished.
At a percentile reading of 44.7% services in EU is the relative weakest
sector, followed by consumer confidence (58th percentile) and retailing
(66th percentile). So far only services are performing at a level that
is short of their usual mid-point. And the service sector is losing
momentum fast.
On a country level sentiment is near its range mid-point in
Italy (54.4 percentile) and Spain (46.5 percentile). Germany (58.4
percentile) and France are doing better than that but still are fading.
France, especially, is staying in its range’s 75th percentile. The UK,
an EU member, is also still strong in the 70th percentile of its range
for economic sentiment.
But make no mistake about it, the trends are poor. The
weakness extends back to about June. EMU sentiment has dropped (m/m) in
each of the past eight months. French and UK sentiment has dropped in
five of eight of those months. Spain’s sentiment fell in six of eight
months; Italy and Germany in seven of eight.
Over this period the EMU index has shed 9.9 points, Italy has
lost 10.4 points and the UK has dropped 9.4 points. German sentiment
dropped 8.5 points, Spain’s sentiment fell by 7.4 points and France’s
eroded by just 4.9 points.
From their cycle peaks, however, not just the past eight
months, Italy (-12.9) and Spain (-12.6) have made the largest drops
followed by the UK (-11.0). Germany (-8.5) and France have declined the
least with France’s cycle peak to current skid of 5.7 points being the
smallest among the largest EMU economies. Still, its momentum points
lower.
In various ways we can construct measures of country and sector weakness. It is clear that weakness is widespread across countries and regions in the e-Zone. It is not yet clear how far this trend to weakness will play out. But one very disturbing fact is the lack of participation in the recovery and outright weakness of the consumer and in retailing. Expansion cannot last without bringing the consumer along.
| EU Sectors and Country level Overall Sentiment | |||||||||||
|---|---|---|---|---|---|---|---|---|---|---|---|
| EU | Jan 08 |
Dec 07 |
Nov 07 |
Oct 07 |
%tile | Rank | Max | Min | Range | Mean | R-SQ w/ Overall |
| Overall | 103.2 | 105.8 | 106.6 | 108.8 | 69.9 | 81 | 116 | 73 | 43 | 100 | 1.00 |
| Industrial | 2 | 2 | 3 | 2 | 85.3 | 28 | 7 | -27 | 34 | -7 | 0.88 |
| Consumer Confidence | -10 | -7 | -7 | -5 | 58.6 | 97 | 2 | -27 | 29 | -10 | 0.83 |
| Retail | -3 | 2 | 4 | 2 | 66.7 | 49 | 6 | -21 | 27 | -6 | 0.46 |
| Construction | -4 | -3 | -1 | 0 | 84.4 | 27 | 3 | -42 | 45 | -17 | 0.43 |
| Services | 11 | 15 | 14 | 19 | 44.7 | 91 | 32 | -6 | 38 | 17 | 0.81 |
| % m/m | Based on Level | Level | |||||||||
| EMU | -1.6% | -0.7% | -1.2% | -0.8% | 65.1 | 91 | 117 | 73 | 44 | 100 | 0.94 |
| Germany | -1.9% | -0.3% | 0.2% | -0.7% | 58.4 | 83 | 121 | 79 | 42 | 99 | 0.65 |
| France | -0.8% | -1.6% | -0.5% | 0.5% | 75.4 | 54 | 119 | 72 | 47 | 100 | 0.79 |
| Italy | -1.3% | 2.3% | -4.2% | -0.2% | 54.4 | 112 | 121 | 71 | 50 | 100 | 0.78 |
| Spain | -1.6% | -1.4% | -0.1% | -2.7% | 46.5 | 182 | 118 | 67 | 51 | 100 | 0.65 |
| Memo: UK | -2.2% | -1.0% | -4.5% | -2.0% | 70.5 | 91 | 118 | 69 | 50 | 100 | 0.42 |
| Since 1990 except Services (Oct 1996) 208 | -Count | Services: | 126 | -Count | |||||||
| Sentiment is an index, sector readings are net balance diffusion measures | |||||||||||

Tom Moeller
AuthorMore in Author Profile »Prior to joining Haver Analytics in 2000, Mr. Moeller worked as the Economist at Chancellor Capital Management from 1985 to 1999. There, he developed comprehensive economic forecasts and interpreted economic data for equity and fixed income portfolio managers. Also at Chancellor, Mr. Moeller worked as an equity analyst and was responsible for researching and rating companies in the economically sensitive automobile and housing industries for investment in Chancellor’s equity portfolio. Prior to joining Chancellor, Mr. Moeller was an Economist at Citibank from 1979 to 1984. He also analyzed pricing behavior in the metals industry for the Council on Wage and Price Stability in Washington, D.C. In 1999, Mr. Moeller received the award for most accurate forecast from the Forecasters' Club of New York. From 1990 to 1992 he was President of the New York Association for Business Economists. Mr. Moeller earned an M.B.A. in Finance from Fordham University, where he graduated in 1987. He holds a Bachelor of Arts in Economics from George Washington University.
More Economy in Brief


