 Global| Sep 30 2005
U.S. Personal Income Fell
by:Tom Moeller
|in:Economy in Brief
Summary
Personal income fell 0.1% last month after an unrevised 0.3% gain in July. Consensus expectations had been for a 0.3% August increase. The Commerce Department indicated that declines in rental & proprietors' income due to Hurricane [...]
Personal income fell 0.1% last month after an unrevised 0.3% gain in July. Consensus expectations had been for a 0.3% August increase. The Commerce Department indicated that declines in rental & proprietors' income due to Hurricane Katrina probably reduced the two measures by a combined $100 billion annualized.
Wages & salaries rose 0.2% (6.6% y/y) in August following an upwardly revised 0.7% increase in July. Factory sector wages rose 0.1% (4.7% y/y) after a 0.5% July increase. Service sector wages rose 0.2% (7.7% y/y) after an upwardly revised 0.9% July surge.
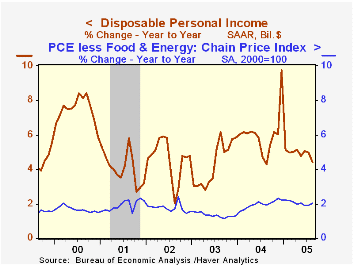
Disposable personal income fell 0.1% (+4.4% y/y) following two months of 0.4% increase. Adjusted for prices which rose 0.5%, take home pay fell 0.5% (+1.4% y/y).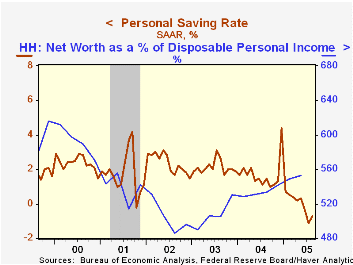
Personal consumption expenditures fell 0.5% due to a sharp drop in light vehicle sales that pulled spending on durables down 8.9% (+3.2% y/y). Nondurables outlays surged 1.1% (9.4% y/y). Spending on gasoline & fuel oil rose 5.7% (32.4% y/y) pumped by an 8.6% m/m increase in gasoline prices that rose another 16.8% this month. Services spending increased 0.4% (5.9% y/y) for the second consecutive month.
The personal savings rate remained negative for the third consecutive month. Nevertheless, the Federal Reserve indicated last week that household sector net worth (from the Flow of Funds Accounts) improved in 2Q to a four year high due to an increase in owners' equity in real estate which has averaged 11.3% per year since 2001.
The PCE chain price index rose 0.5% last month. Less food & energy prices rose 0.2% (2.0% y/y) following two months of 0.1% gain.
What's Driving Wage Inequality? from the Federal Reserve Bank of Richmond can be found here.
Inflation Modeling: A Policy Maker's Perspective, remarks made by Federal Reserve Board Governor Donald L. Kohn is available here.
| Disposition of Personal Income | Aug | July | Y/Y | 2004 | 2003 | 2002 |
|---|---|---|---|---|---|---|
| Personal Income | -0.1% | 0.3% | 5.6% | 5.9% | 3.2% | 1.8% |
| Personal Consumption | -0.5% | 1.2% | 6.6% | 6.5% | 4.9% | 4.2% |
| Savings Rate | -0.7% | -1.1% | 1.5% | 1.7% | 2.1% | 2.4% |
| PCE Chain Price Index | 0.5% | 0.3% | 3.0% | 2.6% | 1.9% | 1.4% |
| Less food & energy | 0.2% | 0.1% | 2.0% | 2.0% | 1.3% | 1.8% |
by Tom Moeller September 30, 2005
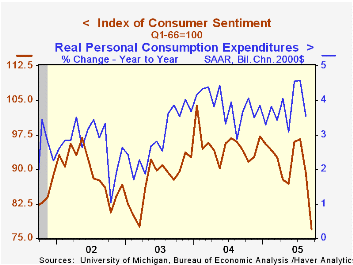
The University of Michigan indicated that its final reading of consumer sentiment during September was unchanged from the preliminary indication of a 13.7% m/m decline to 76.9, the lowest level in over ten years. The September decline followed a 7.7% drop in August and Consensus expectations had been for improvement to 78.0 in August.
During the last ten years there has been a 78% correlation between the level of consumer sentiment and the y/y change in real consumer spending.
Consumer expectations were depressed 17.7% as the index of expected business conditions during the next 12 months cratered 39.2% (-46.6% y/y). Unemployment was expected to rise but interest rates were expected to decline.
The mean expected inflation rate for the next twelve months rose to 5.5% from 3.7% in August and that helped erode expectations for real income by 1.3% (-7.3% y/y).
The current conditions index fell 9.3% m/m, roughly double the decline in August. Sentiment regarding personal finances tumbled 12.0% m/m and was at its worst level in over two years.
The University of Michigan survey is not seasonally adjusted.The mid-month survey is based on telephone interviews with 250 households nationwide on personal finances and business and buying conditions. The survey is expanded to a total of 500 interviews at month end.
| University of Michigan | Sept (Final) | Sept (Prelim.) | August | Y/Y | 2004 | 2003 | 2002 |
|---|---|---|---|---|---|---|---|
| Consumer Sentiment | 76.9 | 76.9 | 89.1 | -18.4% | 95.2 | 87.6 | 89.6 |
| Current Conditions | 98.1 | 97.7 | 108.2 | -5.4% | 105.6 | 97.2 | 97.5 |
| Consumer Expectations | 63.3 | 63.6 | 76.9 | -28.1% | 88.5 | 81.4 | 84.6 |
by Tom Moeller September 30, 2005
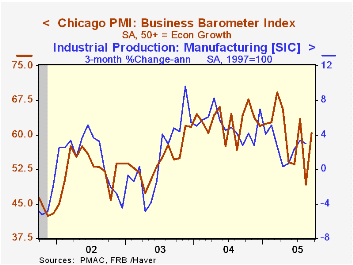
The Chicago Purchasing Managers Business Barometer improved unexpectedly in September to 60.5, recovering most of the 14.3 point decline in August. Consensus expectations had been for a slight increase to 52.
During the last ten years there has been a 65% correlation between the level of Chicago PMI and the three month change in factory sector industrial production.
The new orders index rose 16.9 points after a 23.1 point drop in August but the production index gained back less than half of the 14.3 point August shortfall. Employment fell for the fifth month in the last six. During the last ten years there has been a 75% correlation between the level of the employment index and the three month change in factory sector employment.
The index of prices surged 13.4 points to the highest level since Januarys. During the last ten years there has been an 86% correlation between the Chicago price index and the three month change in the "core" intermediate goods PPI.
| Chicago Purchasing Managers Index, SA | Sept | Aug | Sept '04 | 2004 | 2003 | 2002 |
|---|---|---|---|---|---|---|
| Business Barometer | 60.5 | 49.2 | 64.3 | 62.9 | 54.6 | 52.8 |
| New Orders | 63.4 | 46.5 | 71.8 | 67.0 | 58.0 | 56.2 |
| Prices Paid | 76.3 | 62.9 | 86.9 | 80.1 | 55.8 | 56.9 |
by Carol Stone September 30, 2005
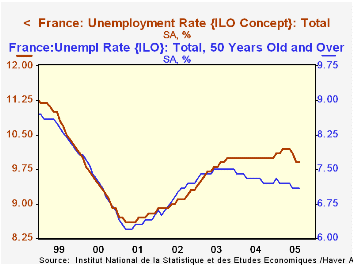
As we have noted recently, European economic performance has been basically flat. Today, another piece of evidence in this direction comes from France, which reported its August unemployment rate steady at July's 9.9%. This does continue the reversal of a modest uptick in the rate to 10.2% in March, April and May. So conditions are not worsening, as it might have appeared during the spring. But the foundation appears fairly tenuous ahead of a winter when heating and other energy costs are likely to be burdensome for even the strongest economies.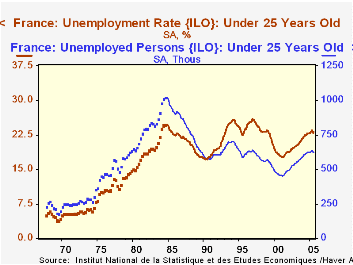
These data, reported by age group, highlight another feature of the French labor market: the extraordinarily high unemployment rate among younger workers. The overall rate has risen a moderate 1.3 percentage points from a low of 8.6% in the spring of 2001. But that for workers under age 25, now at 23.1%, is up 5.5 percentage points over the same period. Similarly, the total number of unemployed is now 2.712 million, up 17.7% from 2.304 in March 2001, while those under 25 have increased to 625,000 from 452,000, a substantial 38.3% advance. Among the other age groups featured in the French data, for "middle-aged" workers, ages 25-49, unemployment has risen only modestly, with their rate at 9.0%, up from 8.0% at its mid-2001 low and the number unemployed up only about 8% during that period. Older workers have seen a larger percentage increase in their idle numbers, nearly 32%, but their rate is up just 0.9 percentage point from 6.2% to 7.1%. Perhaps more notably, since mid-2003 the rate for this last group is actually down a bit and the mid-range group has seen its rate flat.
Over a longer period, the picture for the youngest group gives greater concern; they have seen their number unemployed ratchet downward from about 1.0 million in 1985 to the 625,000 mentioned earlier, but their unemployment rate is virtually the same at 23%-plus. Thus, by implication, job opportunities for young would-be French workers have diminished markedly.
| France Unemployment Rates Seasonally Adjusted |
Aug 2005 | July 2005 | June 2005 | Aug 2004 | 2004 | 2003 | 2002 |
|---|---|---|---|---|---|---|---|
| Total | 9.9 | 9.9 | 10.1 | 10.0 | 10.0 | 9.8 | 9.1 |
| Age under 25 | 23.1 | 23.0 | 23.3 | 22.6 | 22.4 | 20.7 | 19.3 |
| Age 25 - 49 | 9.0 | 9.0 | 9.1 | 9.1 | 9.1 | 8.9 | 8.3 |
| Age 50-plus | 7.1 | 7.1 | 7.1 | 7.3 | 7.3 | 7.5 | 6.9 |

Tom Moeller
AuthorMore in Author Profile »Prior to joining Haver Analytics in 2000, Mr. Moeller worked as the Economist at Chancellor Capital Management from 1985 to 1999. There, he developed comprehensive economic forecasts and interpreted economic data for equity and fixed income portfolio managers. Also at Chancellor, Mr. Moeller worked as an equity analyst and was responsible for researching and rating companies in the economically sensitive automobile and housing industries for investment in Chancellor’s equity portfolio. Prior to joining Chancellor, Mr. Moeller was an Economist at Citibank from 1979 to 1984. He also analyzed pricing behavior in the metals industry for the Council on Wage and Price Stability in Washington, D.C. In 1999, Mr. Moeller received the award for most accurate forecast from the Forecasters' Club of New York. From 1990 to 1992 he was President of the New York Association for Business Economists. Mr. Moeller earned an M.B.A. in Finance from Fordham University, where he graduated in 1987. He holds a Bachelor of Arts in Economics from George Washington University.
More Economy in Brief


