 Global| Aug 31 2006
U.S. Personal Income Again Up 0.6%, Core Price Inflation Eased
by:Tom Moeller
|in:Economy in Brief
Summary
Personal income increased 0.6% last month, the same as during June which was unrevised. The gain slightly outpaced Consensus expectations for a 0.5% rise. Wage & salary disbursements again were strong and rose 0.6% (7.9% y/y) for the [...]
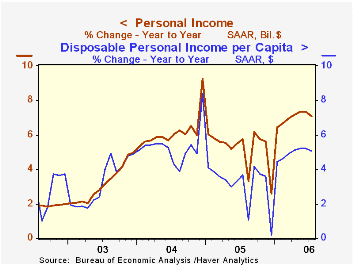
Personal income increased 0.6% last month, the same as during June which was unrevised. The gain slightly outpaced Consensus expectations for a 0.5% rise.
Wage & salary disbursements again were strong and rose 0.6% (7.9% y/y) for the second consecutive month. Wages in the private service-producing industries paced the increase with a 0.8% (8.6% y/y) while factory sector wages rose a lesser 0.3% (7.5% y/y) but the June increase was revised up to 0.5%.
Interest income fell 0.1% (9.6% y/y) after three months of greater than 1.0% increase and dividend income jumped another 1.0% (11.3% y/y).
Disposable personal income jumped 0.7% (6.0% y/y), up from the 0.5% average of this year's first six months. Personal taxes fell 0.3% (+14.9% y/y).
Adjusted for price inflation, disposable personal income rose 0.3% (2.5% y/y). Real disposable income per capita rose 0.3% (1.6% y/y), the same as the prior monthPersonal consumption jumped 0.8%, double the prior month's unrevised increase and matched Consensus expectations. Adjusted for price inflation spending posted the largest increase of the year with a 0.5% gain (2.4% y/y) led by a 1.6% (-1.7% y/y) rise in real durables spending.
The PCE chain price index rose a less than expected 0.3% and the prior month's gain was revised down. Less food & energy prices rose 0.1% (2.4% y/y), the smallest m/m increase this year. Expectations had been for a 0.2% rise.
The personal savings rate was again negative, but prior month's figures were revised less negative. Should the Decline in the Personal Saving Rate Be a Cause for Concern? from the Federal Reserve Bank of Kansas City is available here.
A Primer on Inflation (with Comments on Real Estate in the Metroplex), yesterday' speech by Dallas Federal Reserve Bank President Fisher can be found here.
| Disposition of Personal Income | July | June | Y/Y | 2005 | 2004 | 2003 |
|---|---|---|---|---|---|---|
| Personal Income | 0.6% | 0.6% | 7.1% | 5.2% | 6.2% | 3.2% |
| Personal Consumption | 0.8% | 0.4% | 5.9% | 6.5% | 6.6% | 4.8% |
| Savings Rate | -0.9% | -0.7% | -0.9% (July '05) | -0.4% | 2.0% | 2.1% |
| PCE Chain Price Index | 0.3% | 0.1% | 3.4% | 2.9% | 2.6% | 2.0% |
| Less food & energy | 0.1% | 0.2% | 2.4% | 2.1% | 2.0% | 1.4% |
by Tom Moeller August 31, 2006
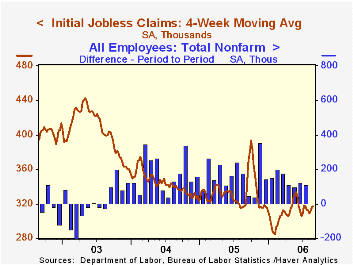
Last week, initial claims for unemployment insurance fell 2,000 to 316,000 after an upwardly revised 4,000 increase during the prior week. Consensus expectations had been for 315,000 claims.
During the last ten years there has been a (negative) 78% correlation between the level of initial claims and the m/m change in nonfarm payroll employment.
The four-week moving average of initial claims increased to 317,500 (0.1% y/y).
Continuing claims for unemployment insurance rose 3,000 following a deepened 18,000 decline during the prior week.
The insured rate of unemployment was steady at 1.9% where it has been since February.
U.S. maneuvers through choppy waters from the Federal Reserve Bank of St. Louis is available here.
| Unemployment Insurance (000s) | 8/26/06 | 8/19/06 | Y/Y | 2005 | 2004 | 2003 |
|---|---|---|---|---|---|---|
| Initial Claims | 316 | 318 | -1.2% | 332 | 343 | 403 |
| Continuing Claims | -- | 2,486 | -4.6% | 2,662 | 2,924 | 3,532 |
by Tom Moeller August 31, 2006
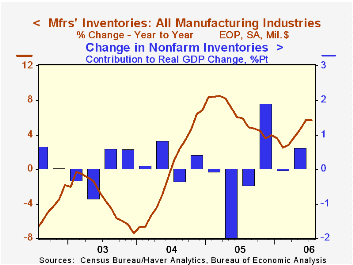
Factory inventories rose 0.6% last month after a revised 0.9% June jump. The 8.1% annual rate of accumulation through July is double the rate of accumulation during all of last year.
Primary metals inventories again were firm and rose 1.4% (8.6% y/y) while inventories of computers & electronic products jumped 1.3% (8.2% y/y). Inventories of electrical equipment surged 1.2% (10.2% y/y) and machinery inventories recovered 0.5% (4.4% y/y) after a slight June decline.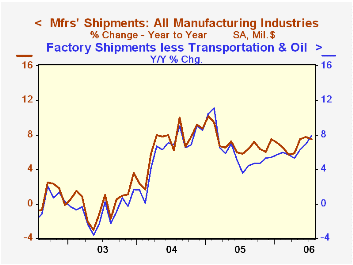
Total factory orders slipped 0.6% after two months of sharp increase. Durable goods orders fell 2.5%, a decline that was little revised from the advance report of a 2.4% drop. Factory orders less transportation rose 1.1% (10.3% y/y).
Factory shipments were unchanged but less transportation rose a sharp 1.1% (9.0% y/y). Petroleum shipments surged 3.6% (18.7% y/y). Factory shipments less transportation & petroleum rose a strong 0.8% (7.9% y/y).
Unfilled orders jumped again, by 1.3% last month and less the transportation sector altogether backlogs were also strong and surged 1.7% (16.0% y/y).
| Factory Survey (NAICS) | July | June | Y/Y | 2005 | 2004 | 2003 |
|---|---|---|---|---|---|---|
| Inventories | 0.6% | 0.9% | 5.7% | 4.0% | 6.9% | -7.4% |
| New Orders | -0.6% | 1.5% | 8.4% | 8.5% | 7.5% | 0.9% |
| Shipments | 0.0% | -0.1% | 7.5% | 7.1% | 6.8% | 0.2% |
| Unfilled Orders | 1.3% | 1.7% | 20.0% | 16.3% | 4.5% | -1.0% |
by Tom Moeller August 31, 2006
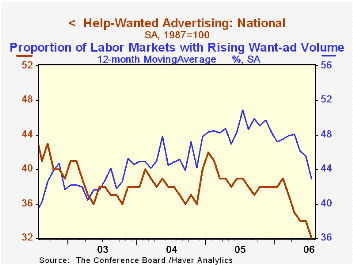
The Conference Board's Index of Help-Wanted Advertising dropped to new forty five year low of 32 in July after revised stability in June at 34.
During the last ten years there has been a 57% correlation between the level of help-wanted advertising and the three month change in non-farm payrolls.
The proportion of labor markets with rising want-ad volume slipped back to 41% but remained above the May low of 27%.
The Conference Board surveys help-wanted advertising volume in 51 major newspapers across the country every month.
The latest help wanted report from the Conference Board is available here.
| Conference Board | July | June | July '05 |
|---|---|---|---|
| National Help Wanted Index | 32 | 34 | 39 |
by Carol Stone August 31, 2006
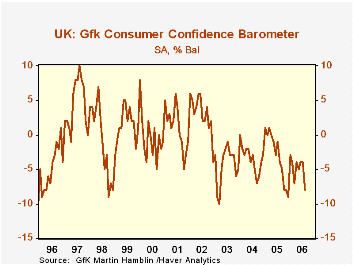
Consumers in the UK apparently reacted to the Bank of England's early August rate increase as they reported a significant increase in their concern over the the UK economic outlook in the August consumer confidence survey conducted by GfK NOP (formerly GfK Martin Hamblin). The overall consumer confidence barometer fell to -8 for August from -4 in both June and July and also -4 in August 2005. The decline hit in varying degrees both men and women, all age ranges, income brackets and regions of the UK.
However, as seen in the table below, respondents to the survey do not believe they have suffered any erosion in their personal financial condition. In fact, they feel that their current condition has improved slightly from a month ago and their assessment of the last 12 months and the coming 12 months are unchanged from July readings, at +11 and 0, respectively. Instead the deterioration has come in people's views of the macroeconomic situation. The overall economic outlook for the next 12 months is now viewed negatively by a net of 23% of the respondents, sharply worse than the 14% in July and 13% a year ago. Their view of the past year fell by about the same amount, from -28% to -35%.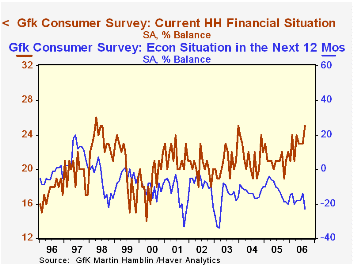
Obviously, it was not just a single policy move by the Bank of England that sparked the drop in confidence. The largest number of people in six years (65%) report in this survey that they have experienced higher inflation over the past 12 months and the most in three-and-a-half years (73%) report that they anticipate inflation will keep rising over the next 12 months. Expectations for rising unemployment are much lower, 36%, but they are also on an uptrend, having bottomed out early in 2005 at just 15%.
Consequently, in the quarterly survey questions for Q3, intentions to buy cars, houses or spend a significant amount of money on home improvements sank to recent lows or reversed improving trends.
The survey results were worse than forecasters expectations, which had called for an overall reading of -5. However, press reports indicate that market reactions were relatively muted in view of improving trends in this week's releases of strengthening trends in the distributive trades survey and rising home prices, as well as the concentration in this survey on the macroeconomic situation, not on personal finances.
All of these data, including series on the distributive trades survey and Nationwide home prices, are contained in Haver's UK database and the surveys are also both in our international surveys database, INTSRVYS.
| % Balance, Seas Adj | Aug 2006 | July 2006 | June 2006 | Aug 2005 | 2005 | 2004 | 2003 |
|---|---|---|---|---|---|---|---|
| Consumer Confidence Barometer | -8 | -4 | -4 | -4 | -3 | -3 | -4 |
| Financial Situation of Households: Current | 25 | 23 | 23 | 21 | 21 | 21 | 21 |
| General Economic Situation: Next 12 Mos. | -23 | -14 | -18 | -13 | -12 | -13 | -18 |
Tom Moeller
AuthorMore in Author Profile »Prior to joining Haver Analytics in 2000, Mr. Moeller worked as the Economist at Chancellor Capital Management from 1985 to 1999. There, he developed comprehensive economic forecasts and interpreted economic data for equity and fixed income portfolio managers. Also at Chancellor, Mr. Moeller worked as an equity analyst and was responsible for researching and rating companies in the economically sensitive automobile and housing industries for investment in Chancellor’s equity portfolio. Prior to joining Chancellor, Mr. Moeller was an Economist at Citibank from 1979 to 1984. He also analyzed pricing behavior in the metals industry for the Council on Wage and Price Stability in Washington, D.C. In 1999, Mr. Moeller received the award for most accurate forecast from the Forecasters' Club of New York. From 1990 to 1992 he was President of the New York Association for Business Economists. Mr. Moeller earned an M.B.A. in Finance from Fordham University, where he graduated in 1987. He holds a Bachelor of Arts in Economics from George Washington University.
More Economy in Brief
 Global| Feb 05 2026
Charts of the Week: Balanced Policy, Resilient Data and AI Narratives
by:Andrew Cates


