 Global| Jun 02 2009
U.S. Pending Home Sales Rise To Their Highest Level Since September
by:Tom Moeller
|in:Economy in Brief
Summary
The National Association of Realtors reported that pending sales of existing homes during April rose for the third consecutive month. The 6.7% m/m rise was to the highest level since last September and doubled the unrevised 3.2% March [...]
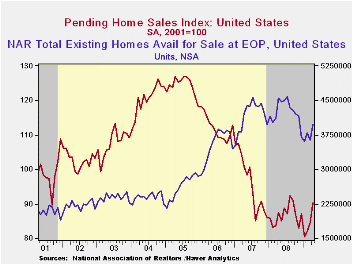
The National Association of Realtors reported that pending sales of existing homes during April rose for the third consecutive month. The 6.7% m/m rise was to the highest level since last September and doubled the unrevised 3.2% March gain. Consensus expectations had been for a slight 0.5% increase in April sales.
Last month's gain in home sales was spread across the country except in the South where they fell slightly from March (+3.6% y/y). In the West (-3.0%y/y) sales recovered a piece of March's decline but remained down sharply from the highs of last summer. Elsewhere, sales in the Northeast jumped by nearly one-third from the March level but they were roughly unchanged from one year earlier. Sales in the Midwest jumped 9.8% from March and have rebounded 11.1% versus 2008.
The home sales figures are analogous to the new home sales
data from the Commerce Department in that they measure existing home
sales when the sales contract is signed, not at the time the sale is
closed. The series dates back to 2001.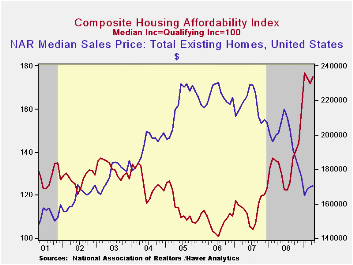
The latest monthly gains in home sales have been accompanied by a rise in home prices. The median sales price of an existing home increased a slight 0.2% in April (-15.4% y/y). The rise followed firm increases during the prior two months. The latest gains in home prices did lower housing affordability slightly but just slightly. Therefore, combined with lower interest rates, the affordability index of a home remained up by 29.2% year-to-year and by three quarters from the 2006 low. The latest level was a record high for the series which extends back to 1970.
As the Spring selling season began, the Realtors Association indicated in an earlier report that the number of homes on the market and available for sale rose 8.8% during April but were down 12.8% versus one year earlier. At the current sales rate there was a 10.2 months' supply of homes on the market and there was a 10.4 months' supply during all of last year, up from the 8.9 months supply during 2007 and 6.5 months during 2006. For single family homes, there was a 9.6 months' supply in April versus a full-year figure of 10.0 months during 2008.
The pending home sales data are available in Haver's PREALTOR database. The number of homes on the market and prices are in the REALTOR database.
| Pending Home Sales (2001=100) | April | March | Y/Y | 2008 | 2007 | 2006 |
|---|---|---|---|---|---|---|
| Total | 90.3 | 84.6 | 3.2% | 86.8 | 95.8 | 112.1 |
| Northeast | 78.9 | 59.5 | 0.8 | 72.6 | 85.6 | 98.5 |
| Midwest | 90.4 | 82.3 | 11.1 | 80.6 | 89.5 | 102.0 |
| South | 93.0 | 93.2 | 3.6 | 89.8 | 107.3 | 127.3 |
| West | 94.8 | 93.1 | -3.0 | 99.3 | 92.1 | 109.5 |
by Tom Moeller June 2, 2009
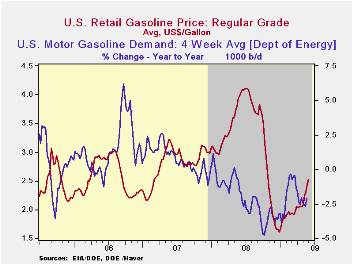
News of a rebound in the U.S. economy has generated the suspicion that more consumers will take to the roads on longer journeys. So far, the evidence of a recovery in driving is limited, but the energy market nevertheless has reacted in advance with higher prices. Regular gasoline prices last week moved even higher to an average $2.52 per gallon of regular. The gains have taken prices up by 91 cents, or by more than one-half, from the December low to the highest level since late-October. Yesterday, the cash market price for a gallon of regular gas rose further to $1.90 per gallon versus $1.85 averaged last week. These also were the highest prices since last October. The figures are reported by the U.S. Department of Energy and can be found in Haver's WEEKLY & DAILY databases.
So far the evidence of a rebound in driving is limited. The
figures for miles driven have rebounded from this past winter but
that's usual as the weather warms. Year-to-year, economic weakness
continues to lower gasoline demand, last week by
2.1%. That is, however, a less severe shortfall than during last
autumn's 5% y/y decline. The change in demand is measured using the
latest four weeks versus the same four weeks in 2008. Demand for
all petroleum products was down 7.3% y/y in the latest week
led by a 38.5% drop in demand for residual fuel oil and a 13.4% drop in
distillate demand. These numbers also are available in Haver's OILWKLY
database.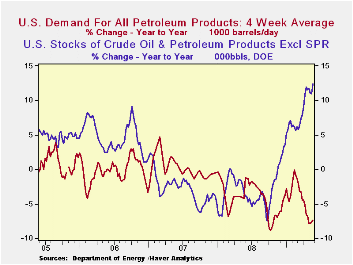
Higher crude oil prices have accompanied the rise in gasoline costs. Crude prices averaged $64.32 last week for a barrel of West Texas Intermediate, up from the December low of $32.37 per barrel. Yesterday, crude oil prices rose even further to $68.58. Prices reached a high of $145.66 last July. The latest price increases occurred despite a 3.1% year-to-year rise in crude oil production during the latest four weeks. In addition, they have occurred despite a 12.3% y/y rise in inventories of crude oil & petroleum products. The figures on crude oil production and inventories are available in Haver's OILWKLY database.
Finally, the gains in the price of natural gas paused last week and it fell back to $3.60 per mmbtu (-69.2% y/y). The latest price was nearly the lowest since 2002 and is down by two-thirds from the high reached in early-July of $13.19/mmbtu.
U.S. Treasury Secretary Timothy F. Geithner's speech titled The United States and China, Cooperating for Recovery and Growth is available here
| Weekly Prices | 06/01/09 | 05/25/09 | Y/Y | 2008 | 2007 | 2006 |
|---|---|---|---|---|---|---|
| Retail Regular Gasoline ($ per Gallon, Regular) | 2.52 | 2.44 | -36.5% | 3.25 | 2.80 | 2.57 |
| Light Sweet Crude Oil, WTI ($ per bbl.) | 64.32 | 60.48 | -49.9% | 100.16 | 72.25 | 66.12 |
by Tom Moeller June 2, 2009
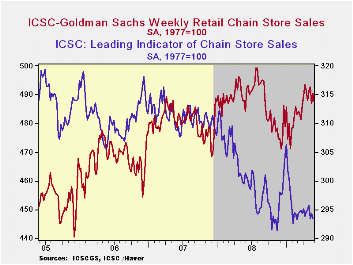
Consumers lost their mood for spending at the end of last month. According to the International Council of Shopping Centers-Goldman Sachs Index, store sales last week gave back with a 0.6% decline virtually all of the prior week's increase. That left sales for the entire month of May down 0.2% from April after that month's 1.4% rise from the March average.
During the last ten years there has been a 64% correlation between the year-to-year growth in chain store sales and the growth in general merchandise sales. These weekly figures are available in Haver's SURVEYW database.
The ICSC-Goldman Sachs retail chain-store sales index is constructed using the same-store sales (stores open for one year) reported by 78 stores of seven retailers: Dayton Hudson, Federated, Kmart, May, J.C. Penney, Sears and Wal-Mart.
Prospects for spending also were tepid last week as indicated by the leading indicator of sales. It fell a modest 0.3% in the latest week. The May average stands just below April.
| ICSC-UBS (SA, 1977=100) | 05/30/09 | 05/23/09 | Y/Y | 2008 | 2007 | 2006 |
|---|---|---|---|---|---|---|
| Total Weekly Chain Store Sales | 487.4 | 490.5 | 0.6% | 1.4% | 2.8% | 3.3% |
by Robert Brusca June 2, 2009
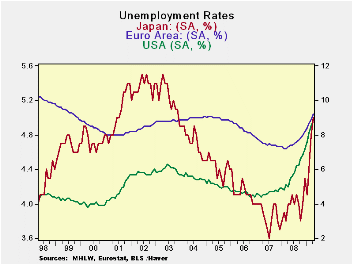
Unemployment rates are on the rise around the world. In EMU
the new rate jumped up to 9.2%; the highest rate for the Area in 9-1/2
years (Sept 1999). There have been 3.1million jobs losses since the
recession began. The US has seen a sharp rise in its rate of
unemployment over the past year, a gain of 3.9%. This surpasses the
1.9% point rise in EMU and the 1% point rise in Japan. However, the
rise in Spain as been of a whopping 8.1 percentage points, bringing in
its overall rate to 18.1%. And that spells e-Zone trouble.
Since the start of the US recession in December of 2007 the
German rate of unemployment has dropped – dropped - by 0.2% points. The
French rate has risen by 0.2% points. Spain’s U-rate is up by 9.2%
points. The US unemployment rate is higher by 4% points. In Japan the
U-rate is up by 1.3% points.
Spain’s rate has jumped as the property market has collapsed.
The rise there appears to have a very large structural element. In the
US the rise seems to be mostly cyclical but it is a substantial rise: a
gain of four percentage points compared to a level of 4.9% in December
of 2007.
Europe seems to have forestalled much of the rise in the rate
of unemployment – Spain excepted, of course. That leads to the
conclusion that despite a substantial social safety net in Europe, the
rise in unemployment is still in progress and will hit Europe later.
Moreover, Europe has different sorts of stresses as the social safety
net is uneven and spreads stress unevenly, across the Area. EMU is only
a common currency area with some economic harmonization rules; fiscal
policy is left to local custom and practice with two overall metrics in
place to constrain aggregate usage. That lack of commonality is now a
problem for the Area.
For the moment the e-Area’s MFG PMI indices are rising on only
a slight lag with the index in the US. This is with a relatively small
hike in the rate of unemployment in Europe (much of that in Spain) and
a substantial jump in the US. If the unemployment problem in Europe
grows worse, the European recovery that now seems to be on the heels of
the US could suffer substantial erosion. There is also a possibility of
political tensions in Europe as the recessions hit the various EMU
nations unevenly.
| Unemployment rate and changes | ||||||
|---|---|---|---|---|---|---|
| Level | Simple Changes | |||||
| Apr-09 | Mar-09 | Feb-09 | 3-Mo | 6-Mo | 12-Mo | |
| EU-Urate | 8.6 | 8.4 | 8.1 | 0.7 | 1.3 | 1.8 |
| EMU-Urate | 9.2 | 8.9 | 8.7 | 0.8 | 1.4 | 1.9 |
| m/m% | % changes (ar) | |||||
| EU-U 000s | 2.7% | 3.2% | 3.5% | 9.7% | 19.0% | 28.8% |
| EMU-U 000s | 2.8% | 3.1% | 3.0% | 9.1% | 17.7% | 27.0% |
| U-Rates | Apr-09 | Mar-09 | Feb-09 | 3-Mo | 6-Mo | 12-Mo |
| Germany | 7.7 | 7.6 | 7.4 | 0.4 | 0.6 | 0.3 |
| France | 8.9 | 8.8 | 8.6 | 0.4 | 0.9 | 1.3 |
| Spain | 18.1 | 17.3 | 16.5 | 2.5 | 4.9 | 8.1 |
| USA | 8.9 | 8.5 | 8.1 | 1.3 | 2.3 | 3.9 |
| Japan | 5 | 4.8 | 4.4 | 0.9 | 1.2 | 1 |

Tom Moeller
AuthorMore in Author Profile »Prior to joining Haver Analytics in 2000, Mr. Moeller worked as the Economist at Chancellor Capital Management from 1985 to 1999. There, he developed comprehensive economic forecasts and interpreted economic data for equity and fixed income portfolio managers. Also at Chancellor, Mr. Moeller worked as an equity analyst and was responsible for researching and rating companies in the economically sensitive automobile and housing industries for investment in Chancellor’s equity portfolio. Prior to joining Chancellor, Mr. Moeller was an Economist at Citibank from 1979 to 1984. He also analyzed pricing behavior in the metals industry for the Council on Wage and Price Stability in Washington, D.C. In 1999, Mr. Moeller received the award for most accurate forecast from the Forecasters' Club of New York. From 1990 to 1992 he was President of the New York Association for Business Economists. Mr. Moeller earned an M.B.A. in Finance from Fordham University, where he graduated in 1987. He holds a Bachelor of Arts in Economics from George Washington University.
More Economy in Brief


