 Global| Feb 28 2018
U.S. Pending Home Sales Cool
Summary
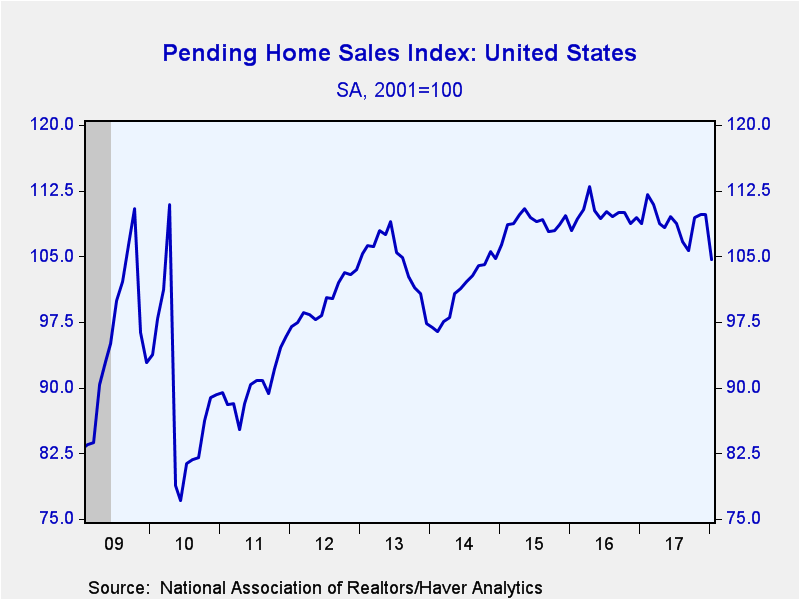
The National Association of Realtors (NAR) reported that pending home sales fell 4.7% (-3.8% y/y) in January to an index level of 104.6 (2001=100). This is the lowest level since October 2014 and is down 7.5% from its current-cycle [...]
The National Association of Realtors (NAR) reported that pending home sales fell 4.7% (-3.8% y/y) in January to an index level of 104.6 (2001=100). This is the lowest level since October 2014 and is down 7.5% from its current-cycle peak in April 2016. However, over the last year pending home sales have been bouncing between roughly 110 and 105. The National Association of Realtors noted that January's weakness was hampered by "woefully low supply levels and the sudden increase in mortgage rates".
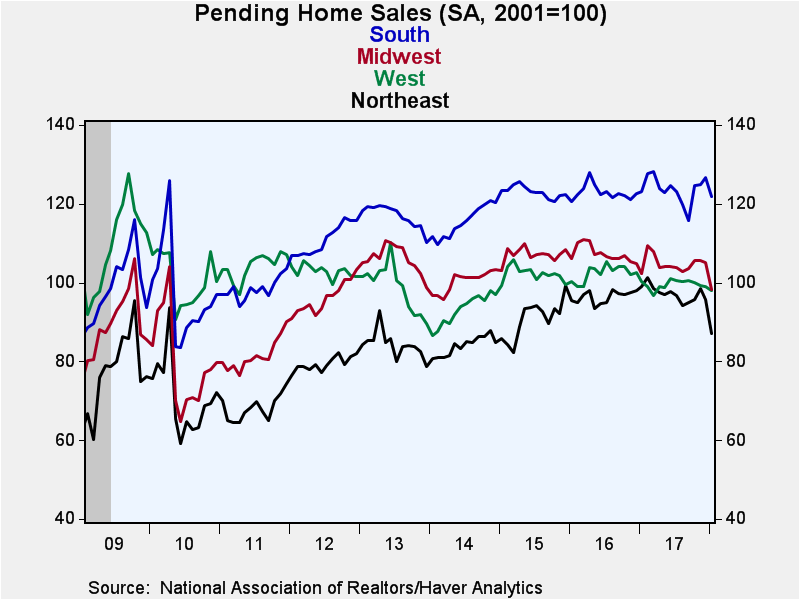
Pending sales were down in all regions led by a 9.0% (-12.1% y/y) drop in the Northeast. Sales in the Midwest fell 6.6% (-4.1% y/y), while sales in the South and West were down 3.9% (-1.1% y/y) and 1.2% (-2.5% y/y) respectively. Sales in the Northeast and Midwest hit multiyear lows, suggesting weather affects. January's U.S. population weighted heating degree days was at its highest level since January 2014.
The pending home sales index measures home sales when the sales contract is signed, analogous to the Census Bureau's new home sales data. In contrast, the National Association of Realtors' existing home sales data are recorded when the sale is closed. In developing the pending home sales index, the NAR found that the level of monthly sales contract activity parallels the level of closed existing home sales in the following two months. The series dates back to 2001, and the data are available in Haver's PREALTOR database. United States Population Weighted Heating and Cooling Degree Days dates back to 1949 and can be found in the USECON database.
| Pending Home Sales (SA, 2001=100) | Jan | Dec | Nov | Jan Y/Y % | 2017 | 2016 | 2015 |
|---|---|---|---|---|---|---|---|
| Total | 104.6 | 109.8 | 109.8 | -3.8 | 108.9 | 110.2 | 108.9 |
| Northeast | 87.0 | 95.6 | 98.5 | -12.1 | 97.1 | 96.4 | 90.5 |
| Midwest | 98.2 | 105.1 | 105.5 | -4.1 | 104.7 | 107.9 | 107.2 |
| South | 121.9 | 126.8 | 124.9 | -1.1 | 123.6 | 123.3 | 123.1 |
| West | 97.9 | 99.1 | 99.3 | -2.5 | 99.4 | 102.7 | 102.5 |
Gerald D. Cohen
AuthorMore in Author Profile »Gerald Cohen provides strategic vision and leadership of the translational economic research and policy initiatives at the Kenan Institute of Private Enterprise.
He has worked in both the public and private sectors focusing on the intersection between financial markets and economic fundamentals. He was a Senior Economist at Haver Analytics from January 2019 to February 2021. During the Obama Administration Gerald was Deputy Assistant Secretary for Macroeconomic Analysis at the U.S. Department of Treasury where he helped formulate and evaluate the impact of policy proposals on the U.S. economy. Prior to Treasury, he co-managed a global macro fund at Ziff Brothers Investments.
Gerald holds a bachelor’s of science from the Massachusetts Institute of Technology and a Ph.D. in Economics from Harvard University and is a contributing author to 30-Second Money as well as a co-author of Political Cycles and the Macroeconomy.


