 Global| Feb 01 2008
U.S. Payrolls Fell Unexpectedly, Revisions & Jobless Rate Down Slightly
by:Tom Moeller
|in:Economy in Brief
Summary
The Bureau of Labor Statistics reported that nonfarm payrolls fell in January by 17,000 versus expectations for a rise of 70,000. In December, the rise payrolls was revised to a stronger gain of 82,000, but November's increase was [...]
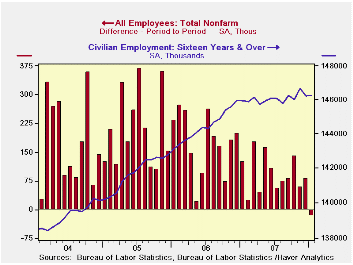
The Bureau of Labor Statistics reported that nonfarm payrolls fell in January by 17,000 versus expectations for a rise of 70,000. In December, the rise payrolls was revised to a stronger gain of 82,000, but November's increase was halved to 60,000. Moreover, the gain for all of last year was revised down slightly to 1.1% from the 1.3% reported earlier.
The decline in jobs during January was the first since August 2003. Five years ago, job declines continued through 2002 & 2003 though economic recession ended in November 2001.
Fewer jobs in government accounted for the outright decline in
overall January employment. An 18,000 worker decline (+0.8% y/y) in
gov't jobs overall owed to a 24,000 worker decline (+0.1% y/y) in state
gov't jobs. That left employment in private industries last month to
rise a negligible 1,000 (0.7% y/y) but a similar preliminary reading
for December was revised up to a gain of 54,000.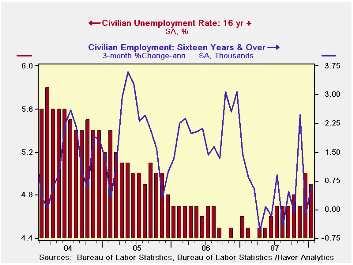
In the private service sector employment rose by a weak 52,000 (1.4% y/y) although December's increase was about doubled to 115,000. Professional & business services jobs fell by 11,000 (+1.6% y/y), the first material m/m decline since 2004. Temporary help services jobs fell 9,000 (-3.3% y/y). Retail employment rose 11,200 (0.4% y/y) but jobs in finance fell 2,000 (-1.1% y/y), the eleventh decline in the last thirteen months (Here is where the earlier job numbers were revised down sharply.)
Jobs in education continued firm and rose 15,700 (3.1% y/y) while job gains in the health care sector also were strong and rose 30,900 (3.1% y/y). Jobs in the leisure & hospitality sector have been strong as well and rose 19,000 (2.7% y/y) in January.
Factory sector payrolls fell another 28,000. Construction
employment fell as well, by 27,000, which was the seventh consecutive
monthly drop.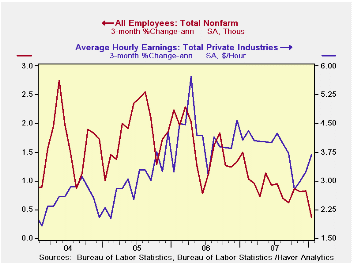
Continuing to portend weakness in job creation was one month diffusion index of 46.2%. This measure of the breadth of job creation amongst industries was at its lowest level since 2003.
The unemployment rate slipped to 4.9% last month after the jump to 5.0% in December. Household employment rose 37,000 (0.2% y/y) while the labor force fell 42,000 (+0.6% y/y). Unemployment fell 79,000 (+7.6% y/y) but the labor force participation rate rose to 66.1%, its highest since last June.
Average hourly earnings rose 0.2%. Factory sector earnings jumped 0.5% (2.9% y/y) and private service-providing earnings rose 0.2% (4.0% y/y).
| Employment: 000s | January | December | November | Y/Y | 2007 | 2006 | 2005 |
|---|---|---|---|---|---|---|---|
| Payroll Employment | -17 | 82 | 60 | 0.7% | 1.1% | 1.8% | 1.7% |
| Previous | -- | 18 | 115 | -- | 1.3% | 1.9% | 1.7% |
| Manufacturing | -28 | -20 | -3 | -1.9% | -1.9% | -0.5% | -0.6% |
| Construction | -27 | -45 | -57 | -3.6% | -1.0% | 4.9% | 5.2% |
| Average Weekly Hours | 33.7 | 33.8 | 33.8 | 33.9 (Jan. '07) |
33.8 | 33.9 | 33.8 |
| Average Hourly Earnings | 0.2% | 0.4% | 0.3% | 3.7% | 4.0% | 3.9% | 2.7% |
| Unemployment Rate | 4.9% | 5.0% | 4.7% | 4.6% (Jan '07) |
4.6% | 4.6% | 5.1% |
by Tom Moeller February 1, 2008
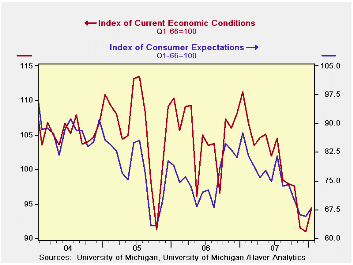
The University of Michigan's consumer sentiment index for all of last month did improve by 3.8% m/m to a reading of 78.4. But that gain was reduced by nearly one half from the rise reported at mid-month. A level for the month of 79 had been expected.
The current conditions index rose by 3.7% m/m, half the rise
reported initially. The gain in current conditions for buying large
household goods was reduced to 6.6% (-12% y/y). The gain in the view of
current personal finances disintegrated to zero (-20.3% y/y) following
two months of decline.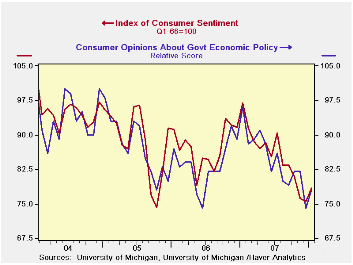
Improvement in expected business conditions during the next year was lowered slightly to 3.8% m/m (-22.3% y/y). Expectations for business conditions during the next five years disappeared (-42.4% y/y) but expectations for personal finances were slightly improved and rose 3.6% (-8.7% y/y).
Expectations for inflation during the next twelve months slipped to 4.0%. For the next five to ten years expectations similarly slipped to a 3.4% rise in prices, equal to the expected gain during all of last year.
Opinions about government policy rose, but by a reduced 5.4% m/m (-18.8% y/y).
The University of Michigan survey is not seasonally adjusted.The reading is based on telephone interviews with about 500 households at month-end; the mid-month results are based on about 300 interviews. The summary indexes are in Haver's USECON database, with details in the proprietary UMSCA database.
| University of Michigan | Jan (Final) | Jan (Prelim) | Dec | Nov | Jan y/y | 2006 | 2005 | 2004 |
|---|---|---|---|---|---|---|---|---|
| Consumer Sentiment | 78.4 | 80.5 | 75.5 | 76.1 | -19.1% | 87.3 | 88.5 | 95.2 |
| Current Conditions | 94.4 | 98.1 | 91.0 | 91.5 | -15.2% | 105.1 | 105.9 | 105.6 |
| Expectations | 68.1 | 69.1 | 65.6 | 66.2 | -22.3% | 75.9 | 77.4 | 88.5 |
by Tom Moeller February 1, 2008
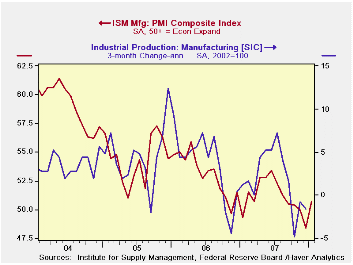
The Institute of Supply Management (ISM) reported that its Composite Index of Manufacturing Sector Activity recovered last month. The m/m gain to 50.7 from a revised 48.4 in December (figures were revised back to 2005) contrasted with Consensus expectations for a slip to 47.5. Data points above 50 indicate growth in factory sector activity.
Last month's composite reading was the highest since August of last year.
During the last twenty years there has been a 64% correlation between the level of the Composite Index and the three month growth in factory sector industrial production.
It is appropriate to correlate the ISM index level with factory sector growth because the ISM index is a diffusion index. It measures growth by being constructed using all of the absolute positive changes in activity added to one half of the no change in activity measures.
Strong gains in the production and in the inventory components accounted for most of the rise in the composite index. The orders and the vendor deliveries components also rose but to much lesser degrees.
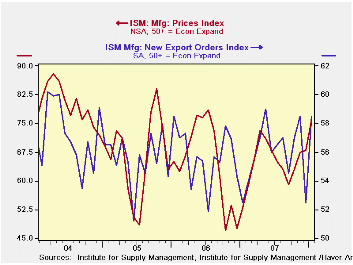
The index of new export orders recovered all of the m/m decline during December. The latest was the highest level since last May.
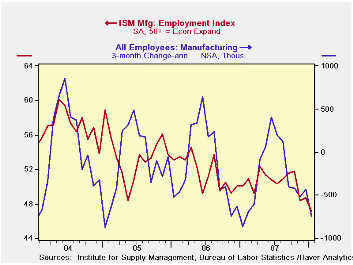
The employment index declined sharply m/m to its lowest level since 2003. During the last twenty years there has been a 67% correlation between the level of the ISM employment Index and the three month growth in factory sector employment.
The prices paid index jumped sharply m/m to its highest level since July 2006. During the last twenty years there has been a 77% correlation between the price index and the three month change in the PPI for intermediate goods.
| January | December | January '07 | 2007 | 2006 | 2005 | |
|---|---|---|---|---|---|---|
| Composite Index | 50.7 | 48.4 | 49.3 | 51.1 | 53.1 | 54.4 |
| New Orders Index | 49.5 | 46.9 | 52.4 | 54.3 | 53.4 | 57.4 |
| Prices Paid Index (NSA) | 76.0 | 68.0 | 53.0 | 64.6 | 65.0 | 66.4 |
by By Robert Brusca February 1, 2008
The NTC MFG PMIs show that EMU MFG took a hit to growth late
in 2007 but has been on a steady mend since then. The EU Commission
readings do not share such a benign view as that report’s industrial
sector as its readings are still losing ground. The NTC framework is
much more upbeat in that respect. However, the NTC data, while more
upbeat in a time-series sense (momentum), has its readings relatively
weaker in early 2008 compared to their past history than the EU
Commission data. For example the over the same time period the EU data
put industrial strength in the 76th percentile of its range stronger
than NTC’s 66th percentile.
The NTC data showed eight of nine members (see table) losing
momentum still in December, but in January it reports only four of nine
still slipping, only the UK among them one of the larger EMU economies.
In January NTC shows only two of these countries with MFG contracting
(readings below 50), Italy does that for the second month running.
| NTC MFG Indices | |||||||
|---|---|---|---|---|---|---|---|
| Jan-08 | Dec-07 | Nov-07 | 3Mo | 6Mo | 12Mo | Percentile | |
| Euro-13 | 52.77 | 52.56 | 52.80 | 52.71 | 52.87 | 54.09 | 66.7% |
| Germany | 54.43 | 53.59 | 53.74 | 53.92 | 54.04 | 55.46 | 71.0% |
| France | 53.92 | 53.85 | 52.55 | 53.44 | 52.32 | 53.03 | 66.9% |
| Italy | 50.80 | 50.74 | 51.34 | 50.96 | 51.71 | 52.88 | 52.7% |
| Spain | 49.77 | 49.51 | 50.73 | 50.00 | 50.43 | 52.65 | 46.1% |
| Austria | 54.10 | 53.21 | 55.00 | 54.10 | 54.16 | 54.38 | 69.4% |
| Greece | 51.44 | 52.67 | 54.28 | 52.80 | 53.51 | 53.64 | 50.6% |
| Ireland | 46.37 | 49.54 | 52.34 | 49.42 | 51.54 | 52.22 | 6.6% |
| Netherlands | 53.10 | 54.40 | 54.47 | 53.99 | 55.11 | 56.39 | 61.1% |
| EU | |||||||
| UK | 50.63 | 52.42 | 53.94 | 52.33 | 53.35 | 54.10 | 47.6% |

Tom Moeller
AuthorMore in Author Profile »Prior to joining Haver Analytics in 2000, Mr. Moeller worked as the Economist at Chancellor Capital Management from 1985 to 1999. There, he developed comprehensive economic forecasts and interpreted economic data for equity and fixed income portfolio managers. Also at Chancellor, Mr. Moeller worked as an equity analyst and was responsible for researching and rating companies in the economically sensitive automobile and housing industries for investment in Chancellor’s equity portfolio. Prior to joining Chancellor, Mr. Moeller was an Economist at Citibank from 1979 to 1984. He also analyzed pricing behavior in the metals industry for the Council on Wage and Price Stability in Washington, D.C. In 1999, Mr. Moeller received the award for most accurate forecast from the Forecasters' Club of New York. From 1990 to 1992 he was President of the New York Association for Business Economists. Mr. Moeller earned an M.B.A. in Finance from Fordham University, where he graduated in 1987. He holds a Bachelor of Arts in Economics from George Washington University.
More Economy in Brief


