 Global| May 06 2011
U.S. Payroll Hiring Is Firm But Jobless Rate Ticks Up
by:Tom Moeller
|in:Economy in Brief
Summary
Nonfarm payrolls increased 244,000 last month after a 221,000 March gain, initially reported as 216,000. The February rise also was revised up to 235,000 from 194,000. The latest gain exceeded Consensus expectations for a 185,000 [...]
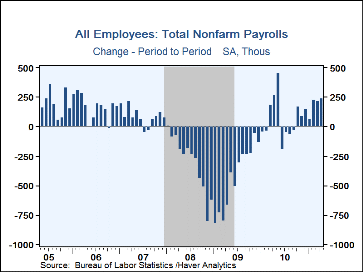
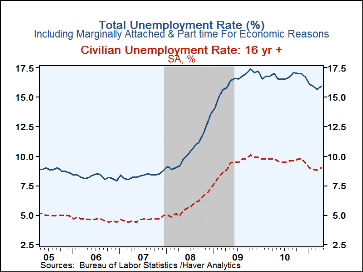
Nonfarm payrolls increased 244,000 last month after a 221,000 March gain, initially reported as 216,000. The February rise also was revised up to 235,000 from 194,000. The latest gain exceeded Consensus expectations for a 185,000 increase. The unemployment rate rose to 9.0% compared to expectations for a further slip to 8.8%
From the establishment jobs survey, the 244,000 increase in jobs
was the strongest since May of last year. Again, a rise in private
service sector employment of 224,000 powered the increase. The increase
reflected a 57,100 rise (0.7% y/y) in retail trade, a 51,000 gain in
professional & business (3.1% y/y), a 49,000 increase (2.2% y/y) in
education and health and a 46,000 rise (1.7% y/y) in leisure &
hospitality.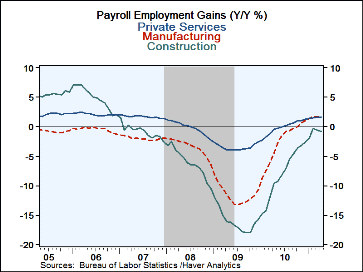 Temporary help services jobs slipped 2,300 (+11.0% y/y), the
first negative month in three. Government jobs fell another 24,000 (-1.8%
y/y) as budget shortfalls continued to force job cutbacks. Local
government payrolls fell 14,000 (-1.8% y/y) while state payrolls were off
8,000 (-0.5% y/y). Jobs with the federal government slipped 2,000 (-4.4%
y/y).
Temporary help services jobs slipped 2,300 (+11.0% y/y), the
first negative month in three. Government jobs fell another 24,000 (-1.8%
y/y) as budget shortfalls continued to force job cutbacks. Local
government payrolls fell 14,000 (-1.8% y/y) while state payrolls were off
8,000 (-0.5% y/y). Jobs with the federal government slipped 2,000 (-4.4%
y/y).
The household survey indicated a rebound in the unemployment rate to 9.0%. It remained, however, well below the high of 10.1% in October 2009. The overall unemployment rate, including those involuntarily working part-time, rose to 15.9% and retraced its March decline. Employment fell 190,000 (0.2% y/y) while the civilian labor force inched up 15,000 (-0.7% y/y). The labor force participation rate remained at its recent low of 64.2% versus the high of 67.1% roughly ten years ago. The average duration of unemployment slipped to 38.3 weeks from its record of 39.0. The number of those unemployed for more than 27 weeks (-12.3% y/y) fell to its lowest since October 2009.
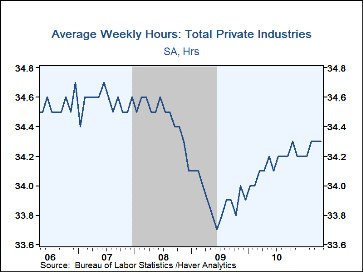
The private sector workweek in April remained stable m/m at 34.3 hrs. for the third consecutive month. Overtime hours rose to 3.3 hrs., the highest since February 2008.
The diffusion index of private sector employment, which measures the breadth of job increase, rose slightly to 64.6%. The factory sector index rose to 65.4% and made up part of its March decline.
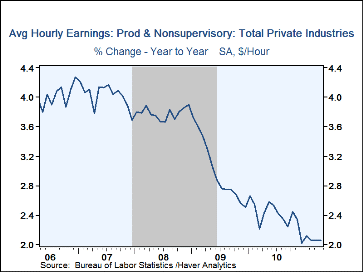
Average hourly earnings beat expectations and rose 0.3% (2.1% y/y) after an upwardly revised no-change in March. A 0.2% increase had been forecasted. Earnings in the goods-producing sector rose 0.1% (2.1% y/y) while services increased 0.3% (2.0% y/y).
The figures referenced above are available in Haver's USECON database. Additional detail can be found in the LABOR and in the EMPL databases. The expectation figures are from Action Economics and are in the AS1REPNA database.
Explaining the Recent Decline in the Unemployment Rate from the Federal Reserve Bank of Chicago can be found here.
| Employment: (M/M Chg., 000s) | Apr | Mar | Feb | Y/Y | 2010 | 2009 | 2008 |
|---|---|---|---|---|---|---|---|
| Payroll Employment | 244 | 221 | 235 | 1.0% | -0.7% | -4.4% | -0.6% |
| Previous | -- | 216 | 194 | -- | -0.5 | -4.3 | -0.6 |
| Manufacturing | 29 | 22 | 37 | 1.7 | -2.7 | -11.6 | -3.4 |
| Construction | 5 | 2 | 39 | -0.8 | -8.1 | -16.0 | -6.1 |
| Private Service Producing | 224 | 194 | 180 | 1.7 | -0.1 | -3.5 | -0.2 |
| Government | -24 | -10 | -26 | -1.8 | -0.3 | 0.3 | 1.3 |
| Average Weekly Hours | 34.3 | 34.3 | 34.3 | 34.1(Apr.'10) | 34.2 | 33.9 | 34.5 |
| Average Hourly Earnings | 0.3% | 0.0% | 0.1% | 2.1% | 2.4% | 3.0% | 3.8% |
| Unemployment Rate (%) | 9.0 | 8.8 | 8.9 | 9.8(Apr.'10) | 9.6 | 9.3 | 5.8 |
By Tom Moeller
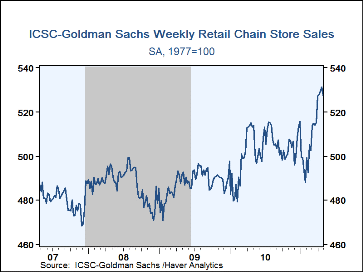
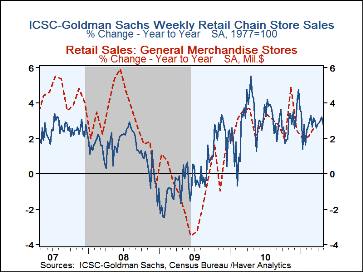
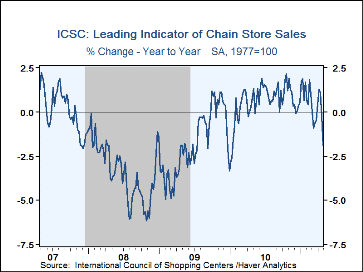
April brought increased buying activity at chain stores. Reported Wednesday was a 0.8% (+2.8% y/y) slip in chain store sales last week, but that still left sales for the month as a whole up 2.7% m/m after a 3.0% gain during March. During the last ten years there has been a 66% correlation between the y/y change in chain store sales and the change in retail sales at general merchandise stores. That correlation recently has increased. General merchandise store sales account for 15% of total retail sales.
The ICSC-Goldman Sachs retail chain-store sales index is constructed using the same-store sales (stores open for one year) reported by 78 stores of seven retailers: Dayton Hudson, Federated, Kmart, May, J.C. Penney, Sears and Wal-Mart. During the last ten years there has been a 69% correlation between the year-to-year growth in chain store sales and the growth in general merchandise retail sales.
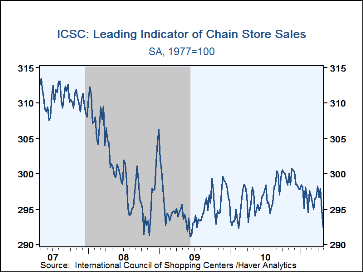
The leading indicator of chain store sales fell hard at the end of the month. As a result, for the month as a whole, the indicator fell slightly, as it has during each month since November. The composite leading economic indicator is compiled from four series: (1) the MBA's volume index of mortgage applications for home purchase (2) the ABC News/Money magazine's survey of consumer buying conditions (3) new filings for jobless benefits and (4) the 30-year government bond yield.
The chain store sales data are in Haver's SURVEYW.
| ICSC-UBS (SA, 1977=100) | 4/30/11 | 4/23/11 | 4/16/11 | Y/Y | 2010 | 2009 | 2008 |
|---|---|---|---|---|---|---|---|
| Total Weekly Chain Store Sales | 527.4 | 531.4 | 529.4 | 2.8% | 2.9% | 0.1% | 1.4% |
By Robert Brusca
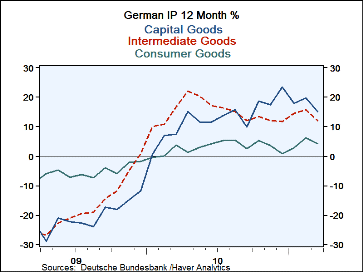 For most German sectors year-over-year growth in industrial output (or IP) has turned only slightly lower. Yet, over three months IP has
accelerated overall led by consumer goods, a sector that has been late to the party. Capital goods, the leading sector thus far in the recovery,
have seen output decline over three months despite increases in output in each of the last two months. Intermediate goods output is exceptionally
strong advancing at an annual rate pace of 33.7% over three-months led mostly by a surge in January and followed by somewhat withering gains in
the next two months.
For most German sectors year-over-year growth in industrial output (or IP) has turned only slightly lower. Yet, over three months IP has
accelerated overall led by consumer goods, a sector that has been late to the party. Capital goods, the leading sector thus far in the recovery,
have seen output decline over three months despite increases in output in each of the last two months. Intermediate goods output is exceptionally
strong advancing at an annual rate pace of 33.7% over three-months led mostly by a surge in January and followed by somewhat withering gains in
the next two months.
Because of these patterns it is difficult to discern how strong German IP may still be. Capital goods seem weaker and we have seen that in sales for capital goods and we know that MFG orders have weakened especially from abroad. But capital goods production is back up in the last two months Even so it has not dug itself out of the hole created by the huge January drop. We are left wondering what is the real condition for German capital goods output? It is weak or recovering? Was January’s drop a fluke?
Germany’s consumer sector appears to be getting in gear late. German consumer goods output is up at a strong 16.8% annual rate pace over three months; it has expanded strongly over the past three months rather consistently. This sector seems to have found its legs.
Intermediate goods output jumped very sharply in January but that surge has faded. The recent month’s rise of 0.3% is meager.
On balance Germany’s output trends are mixed and are somewhat confusing. Coupled with some weakness in orders we should be guarded in our outlook for the future, especially if the euro stays strong or moves higher.
| Total German IP | |||||||
|---|---|---|---|---|---|---|---|
| SAAR Except M/M | Mar-11 | Feb-11 | Jan-11 | 3Mo | 6Mo | 12Mo | Q-2-D |
| IP total | 0.7% | 1.7% | 1.5% | 17.0% | 12.5% | 10.9% | 10.8% |
| Consumer | 0.8% | 1.1% | 2.1% | 16.8% | 5.7% | 4.3% | 8.5% |
| Capital | 0.8% | 2.5% | -5.2% | -7.7% | 15.9% | 15.1% | 0.2% |
| Intermed | 0.3% | 1.3% | 5.8% | 33.7% | 12.7% | 12.1% | 19.9% |
| Memo | |||||||
| Construction | 6.2% | 3.4% | 35.2% | 385.7% | 30.5% | 14.3% | 79.5% |
| MFG IP | 0.5% | 1.8% | 0.3% | 11.0% | 12.4% | 11.9% | 9.2% |
| MFG Orders | -4.0% | 1.9% | 0.0 | 3.7% | 9.0% | 9.8% | 9.6% |

Tom Moeller
AuthorMore in Author Profile »Prior to joining Haver Analytics in 2000, Mr. Moeller worked as the Economist at Chancellor Capital Management from 1985 to 1999. There, he developed comprehensive economic forecasts and interpreted economic data for equity and fixed income portfolio managers. Also at Chancellor, Mr. Moeller worked as an equity analyst and was responsible for researching and rating companies in the economically sensitive automobile and housing industries for investment in Chancellor’s equity portfolio. Prior to joining Chancellor, Mr. Moeller was an Economist at Citibank from 1979 to 1984. He also analyzed pricing behavior in the metals industry for the Council on Wage and Price Stability in Washington, D.C. In 1999, Mr. Moeller received the award for most accurate forecast from the Forecasters' Club of New York. From 1990 to 1992 he was President of the New York Association for Business Economists. Mr. Moeller earned an M.B.A. in Finance from Fordham University, where he graduated in 1987. He holds a Bachelor of Arts in Economics from George Washington University.


