 Global| Feb 04 2005
U.S. Payroll Gain Moderate in January, Jobless Rate Lowest Since 2001
by:Tom Moeller
|in:Economy in Brief
Summary
Non-farm payrolls rose a moderate 146,000 in January following a downwardly revised gain of 133,000 the month prior. Consensus expectations had been for a 200,000 January increase. Benchmark revisions to payrolls beginning in January [...]
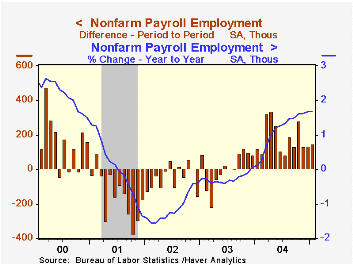
Non-farm payrolls rose a moderate 146,000 in January following a downwardly revised gain of 133,000 the month prior. Consensus expectations had been for a 200,000 January increase. Benchmark revisions to payrolls beginning in January 2000 were modest.
From the separate household survey the unemployment rate fell to 5.2%, the lowest level since October 2001. Employment rose 85,000 (+1.3% y/y) but the labor force fell by 224,000 (0.8% y/y), the second consecutive monthly drop. The labor force participation rate fell to 65.8% versus a high in 2000 of 67.3%.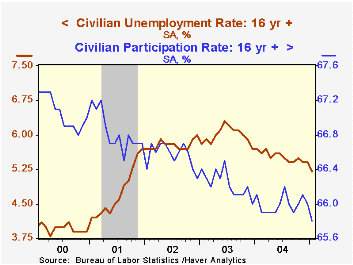
Factory sector payrolls fell a sharp 25,000 reflecting an 11,800 drop in transportation equipment and a 13,000 decline in nondurables. The prior month's initial read of an increase was revised to a 7,000 worker decline.
Construction jobs fell 9,000 (+3.2% y/y), the first monthly decline in nearly a year.
Private service producing payrolls rose 165,000 (2.0% y/y) led by strong gains in finance (2.0% y/y) and transportation (3.1% y/y). Professional & business services also were strong (3.3% y/y) as were jobs in education & health (2.5% y/y). Government employment rose 12,000 (0.8% y/y). The one month diffusion index for private payrolls rose to 57.6.
The index of aggregate hours worked (employment times hours worked) dipped 0.1% (+2.1% y/y) in January and began the new year just slightly above 4Q04.
Average hourly earnings rose the same 0.2% (2.6% y/y) as in an upwardly revised December. Private service producing wages rose 0.3% (2.8% y/y) led by strong growth in information (3.4% y/y) and transportation industries (2.5% y/y). Manufacturing earnings ticked up 0.1% (2.6% y/y).
Fed Chairman Alan Greenspan's Speech on the Current Account can be found here.
| Employment | Jan | Dec | Y/Y | 2004 | 2003 | 2002 |
|---|---|---|---|---|---|---|
| Payroll Employment | 146,000 | 133,000 | 1.7% | 1.1% | -0.3% | -1.1% |
| Manufacturing | -25,000 | -7,000 | 0.2% | -1.2% | -4.9% | -7.2% |
| Average Weekly Hours | 33.7 | 33.8 | 33.8 | 33.7 | 33.7 | 33.8 |
| Average Hourly Earnings | 0.2% | 0.2% | 2.6% | 2.1% | 2.7% | 2.9% |
| Unemployment Rate | 5.2% | 5.4% | 5.7% | 5.5% | 6.0% | 5.8% |
by Tom Moeller February 4, 2005
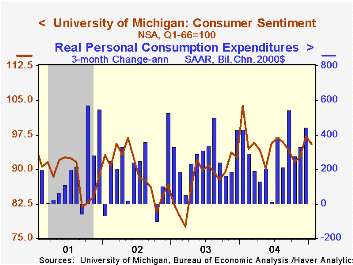
The University of Michigan's January index of consumer sentiment fell to 95.5 versus Consensus expectations for little change from the preliminary reading of 95.8. During the last ten years there has been a 74% correlation between the level of consumer sentiment and the y/y change in real PCE.
Consumer expectations fell 5.7% m/m and reversed nearly all of a 6.7% jump in December. The decline in expectations was to the lowest level since last May and due to lower expectations for growth in real income.
The reading of current conditions improved for the fourth consecutive month as sentiment regarding personal finances vs. a year ago improved to the highest level since late 2000. During the last ten years there has been an 81% correlation between the current conditions index and y/y growth in payroll employment.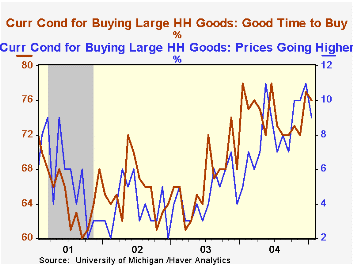
Current conditions for buying large household goods slipped slightly in January but the trend has been improving for nearly two years in large part due to expectations of higher prices.
The University of Michigan survey is not seasonally adjusted.The mid-month survey is based on telephone interviews with 250 households nationwide on personal finances and business and buying conditions. The survey is expanded to a total of 500 interviews at month end.
| University of Michigan | Jan | Dec | Y/Y | 2004 | 2003 | 2002 |
|---|---|---|---|---|---|---|
| Consumer Sentiment | 95.5 | 97.1 | -8.0% | 95.2 | 87.6 | 89.6 |
| Current Conditions | 110.9 | 106.7 | 1.3% | 105.6 | 97.2 | 97.5 |
| Consumer Expectations | 85.7 | 90.9 | -14.4% | 88.5 | 81.4 | 84.6 |

Tom Moeller
AuthorMore in Author Profile »Prior to joining Haver Analytics in 2000, Mr. Moeller worked as the Economist at Chancellor Capital Management from 1985 to 1999. There, he developed comprehensive economic forecasts and interpreted economic data for equity and fixed income portfolio managers. Also at Chancellor, Mr. Moeller worked as an equity analyst and was responsible for researching and rating companies in the economically sensitive automobile and housing industries for investment in Chancellor’s equity portfolio. Prior to joining Chancellor, Mr. Moeller was an Economist at Citibank from 1979 to 1984. He also analyzed pricing behavior in the metals industry for the Council on Wage and Price Stability in Washington, D.C. In 1999, Mr. Moeller received the award for most accurate forecast from the Forecasters' Club of New York. From 1990 to 1992 he was President of the New York Association for Business Economists. Mr. Moeller earned an M.B.A. in Finance from Fordham University, where he graduated in 1987. He holds a Bachelor of Arts in Economics from George Washington University.
More Economy in Brief


