 Global| Aug 07 2009
U.S. Payroll Employment DeclineEases While Unemployment Rate Falls
by:Tom Moeller
|in:Economy in Brief
Summary
Slack in the labor market developed less rapidly last month. The Bureau of Labor Statistics indicated that nonfarm payrolls fell 247,000 during July after declines during the prior two months that were revised slightly shallower. [...]
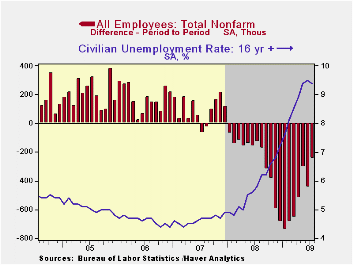
Slack in the labor market developed less rapidly last month. The Bureau of Labor Statistics indicated that nonfarm payrolls fell 247,000 during July after declines during the prior two months that were revised slightly shallower. Expectations for July had been for a deeper 325,000 drop in payrolls and it was the shallowest since August of last year. Nevertheless, so far during this recession employment has fallen by a total of 6.7 million, the record by far for a 19-month period. In percentage terms jobs are down 4.8% since the 2007 peak, also a record. Most recently, the payroll decline moderated to an average 331,000 over the last three months versus a peak three-month rate of 701,000 this past winter.
 Another indication of the economy's slower rate of decline was
that the unemployment rate slipped m/m for the first time since April
of last year. The dip to 9.4% from 9.5% in July compared with
expectations for a rise to 9.6%. The rate's cycle low of 4.4% occurred
in October 2006. Last month, the dip was due to a sharp 422,000 decline
in the labor force (-0.0% y/y) as the number of "discouraged workers"
surged. This 106,000 rise in the number of workers who want a job now
but stopped looking left the y/y gain at 19.0%. Household sector
employment fell 155,000 (-3.8% y/y) which was a moderation from the
323,000-to-1,239,000 monthly declines since last August.
Another indication of the economy's slower rate of decline was
that the unemployment rate slipped m/m for the first time since April
of last year. The dip to 9.4% from 9.5% in July compared with
expectations for a rise to 9.6%. The rate's cycle low of 4.4% occurred
in October 2006. Last month, the dip was due to a sharp 422,000 decline
in the labor force (-0.0% y/y) as the number of "discouraged workers"
surged. This 106,000 rise in the number of workers who want a job now
but stopped looking left the y/y gain at 19.0%. Household sector
employment fell 155,000 (-3.8% y/y) which was a moderation from the
323,000-to-1,239,000 monthly declines since last August.
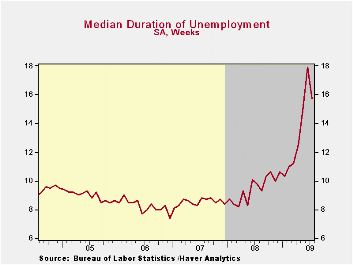
Also from the household survey, the median duration of unemployment slipped m/m to 15.7 weeks but that still was up from 9.8 weeks one year ago. The ranks of the long-term unemployed, however, jumped again m/m and, at 5.0 million, they are more than double one year ago.
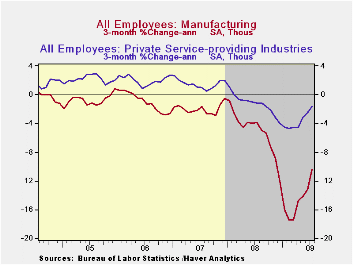 From the payroll survey, the moderation in the rate of job
loss owed to easier declines in both factory sector and private service
payrolls. Manufacturing sector jobs fell 52,000 last month and that was
the mildest decline in one year. On a three-month basis, the 110,000
average monthly decline also was nearly half the rate of this past
winter. Employment in the private service sector dropped 126,000 last
month (-3.2% y/y). Here again the three-month rate of decline of
126,000 was well-reduced from the 393,000 average of this past winter
and fall. The moderation is apparent across industries. Job cuts in the
construction sector also have moderated, but to a lesser extent.
Employment here fell a reduced 76,000 last month but the three-month
average rate of decline amounted to a still-strong 73,000 versus the
worst of 124,000 this winter.
From the payroll survey, the moderation in the rate of job
loss owed to easier declines in both factory sector and private service
payrolls. Manufacturing sector jobs fell 52,000 last month and that was
the mildest decline in one year. On a three-month basis, the 110,000
average monthly decline also was nearly half the rate of this past
winter. Employment in the private service sector dropped 126,000 last
month (-3.2% y/y). Here again the three-month rate of decline of
126,000 was well-reduced from the 393,000 average of this past winter
and fall. The moderation is apparent across industries. Job cuts in the
construction sector also have moderated, but to a lesser extent.
Employment here fell a reduced 76,000 last month but the three-month
average rate of decline amounted to a still-strong 73,000 versus the
worst of 124,000 this winter.
 In the government sector employment was broadly under pressure
as tax revenues lag. Government jobs rose by just 7,000 last month
(0.1% y/y) after two months of decline. Jobs with the Federal
government rose by 12,000 (+2.0% y/y) after two down months. The number
of state gov't jobs fell for the second consecutive month (-0.3% y/y)
and local gov't payrolls were unchanged (-0.1% y/y. Should
the federal government bail out the states? Lessons from past recessions
from the Federal Reserve Bank of Chicago can be found here.
In the government sector employment was broadly under pressure
as tax revenues lag. Government jobs rose by just 7,000 last month
(0.1% y/y) after two months of decline. Jobs with the Federal
government rose by 12,000 (+2.0% y/y) after two down months. The number
of state gov't jobs fell for the second consecutive month (-0.3% y/y)
and local gov't payrolls were unchanged (-0.1% y/y. Should
the federal government bail out the states? Lessons from past recessions
from the Federal Reserve Bank of Chicago can be found here.
The breadth of the cutbacks in employment remained a huge 30.1% amongst industries. That is, however, improved from the worst of this past March. Over a six-month span just 17.3% of firms raised employment which was near the worst. In the factory sector an improved 22.3% of firms raised employment but over a six-month span just 7.2% did.
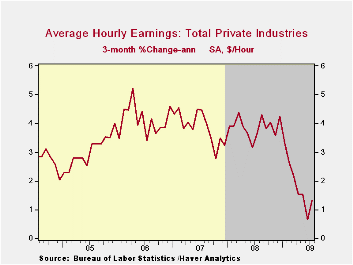
Average hourly earnings rose 0.2% during July and the three-month change seems to have bottomed at a 1.3% annual rate. That compares to to roughly 4% growth from 2006 to 2008. Earnings in the factory sector rose 0.8% and the three-month growth rate improved to 3.8%. Growth in the durable sector's earnings (NSA) jumped over the last three months but earnings in the private service sector remained under pressure at +1.1% during the last three months.
The figures referenced above are available in Haver's USECON database. Additional detail can be found in the LABOR and in the EMPL databases
Raising automotive fuel efficiency from the Federal Reserve Bank of Chicago can be found here.
| Employment: 000s | July | June | May | Y/Y | 2008 | 2007 | 2006 |
|---|---|---|---|---|---|---|---|
| Payroll Employment | -247 | -443 | -303 | -4.2% | -0.4% | 1.1% | 1.8% |
| Previous | -- | -467 | -322 | -- | -- | -- | -- |
| Manufacturing | -52 | -131 | -146 | -12.2% | -3.3% | -2.0% | -0.5% |
| Construction | -76 | -86 | -57 | -14.6% | -5.5% | -0.8% | 4.9% |
| Service Producing | -119 | -220 | -91 | -2.6% | 0.2% | 1.6% | 1.8% |
| Average Weekly Hours | 33.1 | 33.0 | 33.1 | 33.6 (July '08) | 33.6 | 33.8 | 33.9 |
| Average Hourly Earnings | 0.2% | 0.0% | 0.2% | 2.5% | 3.8% | 4.0% | 3.9% |
| Unemployment Rate | 9.4% | 9.5% | 9.4% | 5.8% (July '08) | 5.8% | 4.6% | 4.6% |
by Robert Brusca August 7, 2009
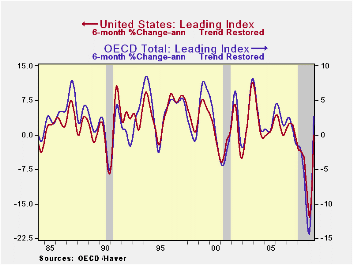
The OECD LEIs are now jumpin.’ The rise is strongly
accelerating across OECD countries; even Japan whose indicator is still
falling is seeing a substantial shift in its negative growth rate to a
substantially diminished pace of decline. The detailed progressive
growth rates from 12-months to six months to three months show that the
acceleration is well in force. The OECD’s preferred reading is on the
six month growth rate. The US rate is now flat compared to declining at
a 16% pace six months ago. The European index is up at a very strong
6.4% pace after dropping at a 12% rate six months ago. Japan is falling
at a 7% rate after dropping at a 22% rate six months ago. What a
difference a half year makes.
The United State’s own LEI from the Conference Board usually
carves out lower recession lows than the OECD LEI for the US. The
Conference Board indicator usually carves out higher highs in the
transition to recovery, by a small amount, as well. In this recession
however the OECD LEI for the US is much weaker than the low for the
Conference Board’s measure based on percentage drops in the respective
indices. As a result, while the OECD index has a bigger US turnaround
from its low to its present value, the positive reading on the
Conference Board LEI is far stronger that the current OECD LEI signal
(the OECD measure is flat over six months).
Different measures capture different aspects of the economy’s
weakness. Right now both of these measures have the same sort of
positive momentum to different degrees but positive momentum
nonetheless. It is interesting that the European economies are showing
much more momentum in this framework. We will have to keep our eye on
the economies and see if European economic performance can live up to
the strong positive signal the OECD has for that region.
| OECD Trend-restored leading Indicators | ||||||
|---|---|---|---|---|---|---|
| Growth progression-SAAR | ||||||
| 3Mos | 6Mos | 12mos | Yr-Ago | |||
| OECD | 11.0% | 2.7% | -6.1% | -2.9% | ||
| OECD7 | 10.4% | 1.3% | -7.6% | -3.3% | ||
| OECD.E-Area | 16.0% | 6.4% | -3.2% | -3.9% | ||
| OECD.Japan | -4.4% | -7.1% | -15.0% | -1.9% | ||
| OECD US | 11.4% | 0.0% | -8.5% | -3.2% | ||
| Six month readings at 6-Mo Intervals: | ||||||
| Recent six | 6Mo Ago | 12Mo Ago | 18MO Ago | |||
| OECD | 2.7% | -14.2% | -4.2% | -1.5% | ||
| OECD7 | 1.3% | -15.8% | -4.2% | -2.5% | ||
| OECD.Eur | 6.4% | -12.0% | -6.9% | -0.7% | ||
| OECD.Japan | -7.1% | -22.3% | 2.0% | -5.6% | ||
| OECD US | 0.0% | -16.3% | -4.3% | -2.2% | ||
| Slowdowns indicated by BOLD RED | ||||||

Tom Moeller
AuthorMore in Author Profile »Prior to joining Haver Analytics in 2000, Mr. Moeller worked as the Economist at Chancellor Capital Management from 1985 to 1999. There, he developed comprehensive economic forecasts and interpreted economic data for equity and fixed income portfolio managers. Also at Chancellor, Mr. Moeller worked as an equity analyst and was responsible for researching and rating companies in the economically sensitive automobile and housing industries for investment in Chancellor’s equity portfolio. Prior to joining Chancellor, Mr. Moeller was an Economist at Citibank from 1979 to 1984. He also analyzed pricing behavior in the metals industry for the Council on Wage and Price Stability in Washington, D.C. In 1999, Mr. Moeller received the award for most accurate forecast from the Forecasters' Club of New York. From 1990 to 1992 he was President of the New York Association for Business Economists. Mr. Moeller earned an M.B.A. in Finance from Fordham University, where he graduated in 1987. He holds a Bachelor of Arts in Economics from George Washington University.
More Economy in Brief


