 Global| Aug 01 2003
U.S. Nonfarm Payrolls Decline
Summary
Nonfarm payrolls declined again in July and figures for May and June were revised downward to show larger declines (see table below). This result was remarkably close to forecasts, which had called for a 50,000 decrease. At the same [...]
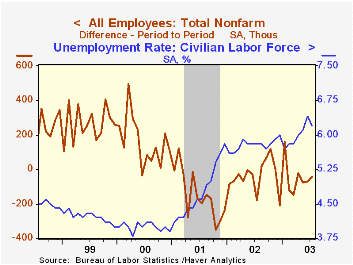
Nonfarm payrolls declined again in July and figures for May and June were revised downward to show larger declines (see table below). This result was remarkably close to forecasts, which had called for a 50,000 decrease. At the same time, the unemployment rate fell 0.2% to 6.2% after its relatively large increase the month before from 6.1% to 6.4%. Forecasters had expected only a 0.1% fall in July.
It was the manufacturing sector that again pulled down the total number of jobs, as a broad array of those industries lost jobs aggregating to 71,000. Durable goods industries were off 54,000 and nondurable goods 17,000. Retail trade (-14,000), government (-10,000) and education and health services (-1,000) were other weak sectors.
In contrast, temporary help agencies had a good gain, increasing 42,000. Including other types of employment agencies, the employment services group surged 73,000, its third consecutive notable rise. This suggests that businesses are starting to staff up, but doing so tentatively, using temp workers until they are more certain their need for workers will be sustained. Construction industries, finance, and leisure and hospitality were other industry groups adding workers in July.
The workweek edged down 0.1 hour to 33.6 hours, a new low. Shorter hours characterized many manufacturing and other goods-producing industries. Average hourly earnings rose 0.3%, the third successive gain of that magnitude after being more sluggish in the winter and early spring.
In the separate household survey, the labor force fell 556,000, basically reversing June’s 611,000 increase. Such swings also characterized the number of people reporting they were employed (down 260,000 in July after a 251,000 increase in June) and those noting unemployment (down 296,000 after a 360,000 rise). About half of the July decline in the labor force occurred among people aged 16-24, suggesting there may be some seasonal influence related to summer vacations from school.
| Employment | July | June | May | Y/Y | 2002 | 2001 | 2000 |
|---|---|---|---|---|---|---|---|
| Payroll Employment | -44,000 | -72,000 | -76,000 | -0.3% | -1.1% | 0.0% | 2.2% |
| Reported last month | -30,000 | -70,000 | |||||
| Manufacturing | -71,000 | -63,000 | -49,000 | -4.2% | -6.9% | -4.8% | -0.3% |
| Average Weekly Hours | 33.6 | 33.7 | 33.7 | 34.0 | 33.9 | 34.0 | 34.3 |
| Average Hourly Earnings | 0.3% | 0.3% | 0.3% | 3.1% | 2.9% | 3.8% | 3.9% |
| Unemployment Rate | 6.2% | 6.4% | 6.1% | 5.8% | 5.8% | 4.8% | 4.0% |
by Carol Stone August 1, 2003
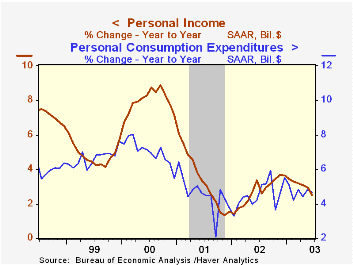
Mild increases in both personal income and expenditures marked the June performance of the consumer sector. Income rose 0.3%, giving the entire first half of 2003 a moderate 3.4% annualized gain. As in May, one of the distinctive features of income growth was another sizable advance in proprietors’ income; it increased 0.8% in June, yielding a whopping 11% annual rate of expansion over the last four months. Profits of small, unincorporated businesses seem to be advancing strongly. Wages and salaries, on a much steadier trend, picked up to a 0.3% gain in June from 0.2% in May and a small outright decline in April.
Consumer spending has also been steady of late, with the last two months, 0.4% in May and 0.3% in June, tracing a smoother path than the wide swings earlier in the year that resulted from uneven buying patterns for motor vehicles and the volatility in gasoline prices. Broadly, expenditures on durable goods rose 0.4% in June, almost the same increase as in May. Outlays for nondurable goods were also up 0.4% in June, but they had been flat in May; the whipsaw in gasoline purchases, down sharply in May and back up somewhat in June, caused most of the upturn in June nondurable goods buying. Spending on services slowed to a 0.2% rise in June after 0.6% in May. Outright declines in outlays for household utilities and recreation in June followed increases in May.
The saving rate remained flat at 3.3% in June, almost the same as in each of the preceding three months.
| Disposition of Personal Income | June | May | Y/Y | 2002 | 2001 | 2000 |
|---|---|---|---|---|---|---|
| Personal Income | 0.3% | 0.3% | 2.5% | 2.7% | 3.3% | 8.0% |
| Personal Consumption | 0.3% | 0.4% | 4.7% | 4.5% | 4.5% | 7.0% |
| Savings Rate | 3.3% | 3.3% | 4.4% | 3.7% | 2.3% | 2.8% |
| PCE Price Deflator | -0.2% | -0.1% | 1.8% | 1.4% | 2.0% | 2.5% |
by Carol Stone August 1, 2003
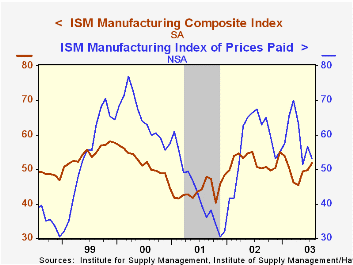
After a sluggish few months that raised concerns about renewed recession, the Institute of Supply Management’s Purchasing Managers’ Index (PMI) rose 2 points in July, crossing above the key 50% expansion/decline line for the first time since February. A 4.4-point gain in new orders was the prime mover in the July improvement, with a larger number of ISM survey participants reporting increases in their orders. Less inventories liquidation, slower deliveries by vendors and a slight pick-up in production also added to the overall index. Employment held just about steady after an encouraging rise last month.
Prices paid for materials and supplies moderated somewhat in July; they appear to be establishing a trend of increases at fewer companies than has generally be the case over the last 15 months. No item is reported “in short supply” and only one raw material and some energy costs were reported up in price in July. While this softening may leave commodity producers less well off, it relieves further pressure on profits of finished goods manufacturers.
| ISM Manufacturing Survey | July | June | May | 2002 | 2001 | 2000 |
|---|---|---|---|---|---|---|
| Composite Index | 51.8 | 49.8 | 49.4 | 52.4 | 44.0 | 51.7 |
| New Orders Index | 56.6 | 52.2 | 51.9 | 56.7 | 46.2 | 52.0 |
| Prices Paid Index (NSA) | 53.0 | 56.5 | 51.5 | 57.6 | 42.9 | 64.8 |
by Carol Stone August 1, 2003
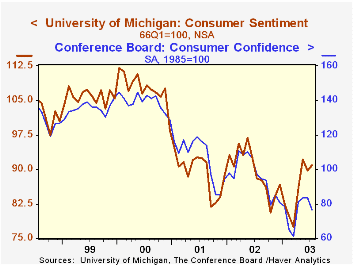
The University of Michigan’s consumer sentiment index edged slightly higher in the latter part of July to 90.9, giving it a 1.2-point increase all together from June’s 89.7 level. The sub-index describing current conditions was 102.1, unchanged from the mid-month reading and up 7.4 points from June. Expectations improved slightly to 83.7 from 82.7 at mid-month, but remain 2.7 points below the June value.
The Michigan Survey’s improvement in July stands in contrast to a decrease in the Conference Board’s Consumer Confidence Index reported Tuesday. That survey gives heavy weight to job-market perceptions, which deteriorated. The decline in nonfarm payrolls in the month would seem to bear out this assessment by consumers. The Michigan survey covers many fewer participants, 500 versus 5,000 for the Conference Board. But Michigan asks many more questions. It may then react more directly to stock market and political events. The better stock market conditions in July and the US’s progress in finding hunted Iraqi leaders may thus have offset in the Michigan survey some of the negative factors that hurt the Conference Board’s result.
| University of Michigan | July (Final) | Mid-July | June | 2002 | 2001 | 2000 |
|---|---|---|---|---|---|---|
| Consumer Sentiment | 90.9 | 90.3 | 89.7 | 89.6 | 89.2 | 107.6 |
by Carol Stone August 1, 2003
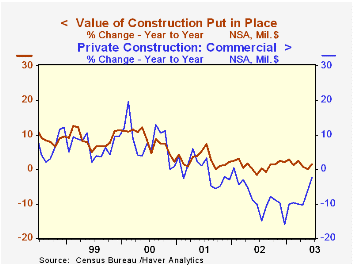
The value of total construction put in place was flat in June as a modest 0.3% decline in private building offset a 1.0% gain in public (government) projects. Within the private sector, residential construction, which accounts for about two-thirds of that sector’s dollar value, fell 0.4%, while most categories of non-residential building firmed. For instance, office building rose 3.1%, commercial projects were up 2.2% and health care added 2.7%.
Among public, government-owned buildings, offices added 5.7%, health care facilities, 6.0% and power projects, 24.0%.
These more detailed categories represent the Census Bureau’s reclassification of construction activity into end-use groups. Finer detail is available for many of the categories; for instance, commercial construction is shown for Automotive sales and parking facilities, drugstores, building supply stores, and both commercial warehouses and mini-storage facilities. Note that start dates vary for some seasonally adjusted line items in 2000 and 2002 and that constant-dollar data are no longer computed.
All that said, total construction activity remained sluggish through June, although it showed some signs of stabilization after a decline that had lasted since January. Notably, while residential building continued to fall through June, commercial projects do seem to be sustaining a long-awaited upturn.
| Construction Put-in-place | June | May | April | Y/Y | 2002 | 2001 | 2000 |
|---|---|---|---|---|---|---|---|
| Total | -0.0% | -0.5% | -0.3% | 1.1% | 1.1% | 2.7% | 8.3% |
| Private | -0.3% | -0.8% | 1.5% | 0.8% | -0.2% | 1.4% | 8.0% |
| Residential | -0.4% | -0.8% | -1.6% | 3.5% | 8.6% | 3.3% | 7.4% |
| Public | 1.0% | 0.5% | 1.3% | 1.9% | 5.2% | 7.4% | 9.6% |
by Carol Stone August 1, 2003
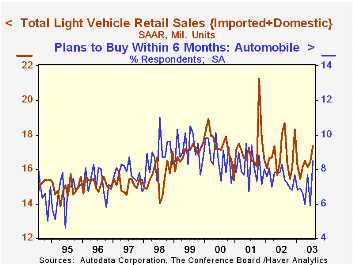
Light vehicle sales picked up considerably in July compared to June, increasing by 910,000 (annual rate). However, auto company reports, which are stated on a year-to-year change basis, showed huge declines relative to July 2002. That month saw heavy sales incentives, however, making it a high base from which to measure such performance. The June-to-July gain was shared by both cars and trucks; domestic truck sales rose especially sharply, from 7.58 million units to 8.25 million. Sales of imported vehicles actually eased slightly on the month.
In recent years, vehicle sales have not shown much relation to consumer confidence measures, but they do have some tendency to move with the Conference Board’s Buying Plans measure for Automobiles. Consumers anticipate their vehicle purchases to some extent; indeed the gain in the July Buying Plans gauge foretold the gain in vehicle sales experienced in the month.
| Light Vehicle Sales (SAAR, Mil.Units) | July | June | May | Y/Y | 2002 | 2001 | 2000 |
|---|---|---|---|---|---|---|---|
| Total | 17.34 | 16.43 | 16.12 | -4.3% | 16.81 | 17.26 | 17.40 |
| Autos | 7.81 | 7.56 | 7.27 | -10.2% | 8.07 | 8.48 | 8.83 |
| Light Trucks | 9.53 | 8.87 | 8.86 | 5.5% | 8.74 | 8.78 | 8.56 |
Carol Stone, CBE
AuthorMore in Author Profile »Carol Stone, CBE came to Haver Analytics in 2003 following more than 35 years as a financial market economist at major Wall Street financial institutions, most especially Merrill Lynch and Nomura Securities. She had broad experience in analysis and forecasting of flow-of-funds accounts, the federal budget and Federal Reserve operations. At Nomura Securities, among other duties, she developed various indicator forecasting tools and edited a daily global publication produced in London and New York for readers in Tokyo. At Haver Analytics, Carol was a member of the Research Department, aiding database managers with research and documentation efforts, as well as posting commentary on select economic reports. In addition, she conducted Ways-of-the-World, a blog on economic issues for an Episcopal-Church-affiliated website, The Geranium Farm. During her career, Carol served as an officer of the Money Marketeers and the Downtown Economists Club. She had a PhD from NYU's Stern School of Business. She lived in Brooklyn, New York, and had a weekend home on Long Island.
More Economy in Brief


