 Global| Dec 05 2003
U.S. Non-farm Payrolls Up Less Than Expected
by:Tom Moeller
|in:Economy in Brief
Summary
Non-farm payrolls rose a less than expected 57,000 in November.Consensus expectations were for a 150,000 rise. Though the gain in October payrolls was revised up slightly to 137,000, September payrolls were revised down to +99,000 [...]

Non-farm payrolls rose a less than expected 57,000 in November.Consensus expectations were for a 150,000 rise. Though the gain in October payrolls was revised up slightly to 137,000, September payrolls were revised down to +99,000 from +125,000.
From the separate household survey, the unemployment rate fell to 5.9% versus expectations for 6.0%. Employment surged another 589,000 (1.5% y/y).
The labor force also surged, up 484,000 (1.4% y/y), as the number of discouraged workers fell sharply.
The one-month diffusion index for private non-farm payrolls rose sharply to 54.7 from an upwardly revised October reading of 53.6. This was the strongest breadth of employment gain since December 2000.
Manufacturing sector payrolls fell another 17,000 (-3.6% y/y), but the one-month diffusion index for factory payrolls improved to 42.3, the highest level since July 2000. Weakness in factory sector jobs was notable last month in nondurable goods industries.
Service producing jobs rose 64,000 (0.2% y/y). The gain was held back by declines in both the financial and in the retail trade industries. Temporary help services jobs were again strong, up 20,800 (5.6% y/y). Education & health services jobs also rose a firm 34,000 (1.9% y/y). Government sector jobs rose just 7,000 (-0.2% y/y).
Construction jobs rose 10,000 (1.6% y/y).
Average hourly earnings rose just 0.1% (2.1% Y/Y), but earnings in the factory sector rose 0.2% (2.3% Y/Y).
The index of aggregate hours worked rose 0.2% and so far in 4Q are up at a 2.5% annual rate versus 3Q. Hours worked fell in 3Q versus 2Q.
| Employment | Nov | Oct | Y/Y | 2002 | 2001 | 2000 |
|---|---|---|---|---|---|---|
| Payroll Employment | 57,000 | 137,000 | -0.2% | -1.1% | 0.0% | 2.2% |
| Manufacturing | -17,000 | -14,000 | -3.6% | -6.9% | -4.8% | -0.3% |
| Average Weekly Hours | 33.9 | 33.8 | 33.8 | 33.9 | 34.0 | 34.3 |
| Average Hourly Earnings | 0.1% | 0.1% | 2.1% | 2.9% | 3.8% | 3.9% |
| Unemployment Rate | 5.9% | 6.0% | 5.9% | 5.8% | 4.8% | 4.0% |
by Tom Moeller December 5, 2003
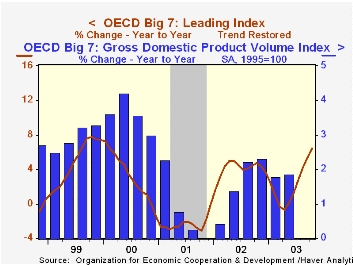
The Index of Leading Indicators for the Major Seven OECD Countries rose 1.0% (6.5% y/y) in October for the seventh consecutive firm monthly gain.
Gains amongst the member country leading indexes again were broad and strong. The leading index for the European Union rose 0.7% (3.9% y/y).
In France, the leading index gained 0.7% (3.2% y/y), the sixth strong gain in as many months. The leaders in Germany boomed 1.3% (6.0% y/y but in Italy the leaders fell 0.2% (2.0% y/y).
In Canada the leading index jumped 1.1% (6.4% y/y) but in the U.K. the leaders only squeaked out a 0.1% uptick (0.2% y/y). Leaders in Japan were little changed (3.7% y/y) for the first month since April.
Leading indicators in the United States surged 1.9% (9.9% y/y).
The latest increase pulled the OECD leading index above its trend level.
Visit the OECD's website at this website.
| OECD Main Economic Indicators | Oct | Sept | Y/Y | 2002 | 2001 | 2000 |
|---|---|---|---|---|---|---|
| OECD Major Seven - Leading Index (Trend Restored) | 125.0 | 123.8 | 6.5% | 4.1% | -2.3% | 3.1% |
| European Union | 121.2 | 120.4 | 3.9% | 3.1% | -1.9% | 3.7% |
| Japan | 104.9 | 104.9 | 3.7% | 0.8% | -3.1% | 2.5% |
| United States | 139.1 | 136.5 | 9.9% | 5.6% | -2.7% | 2.7% |
by Tom Moeller December 5, 2003

Factory orders surged an expected 2.2% in October. The advance report of a jump in durable goods orders was little revised and October orders show a 3.4% (8.4% y/y) pop. Non-durable goods orders rose just 0.7%. That was held back by a 0.7% decline in petroleum refinery orders (shipments) which followed a 4.0% September decline.
Manufacturing inventories were unchanged following five consecutive months of decline. A turn toward inventory accumulation occurred in the electronic products, defense aircraft and miscellaneous categories, but inventories of computers, furniture, and automobiles continued down.
Factory shipments rose 0.7%, but the gain was held back by a 1.4% decline (-2.3% y/y) in shipments from the transportation sector. Shipments excluding transportation jumped 1.1% (4.3% y/y).
| Factory Survey (NAICS) | Oct | Sept | Y/Y | 2002 | 2001 | 2000 |
|---|---|---|---|---|---|---|
| Inventories | 0.0% | -0.3% | -1.1% | -1.8% | -6.1% | 3.8% |
| New Orders | 2.2% | 1.4% | 6.6% | -1.9% | -6.7% | 5.0% |
| Shipments | 0.7% | 1.8% | 3.2% | -2.0% | -5.4% | 4.2% |
| Unfilled Orders | 1.6% | 0.4% | 1.9% | -6.1% | -5.9% | 8.7% |

Tom Moeller
AuthorMore in Author Profile »Prior to joining Haver Analytics in 2000, Mr. Moeller worked as the Economist at Chancellor Capital Management from 1985 to 1999. There, he developed comprehensive economic forecasts and interpreted economic data for equity and fixed income portfolio managers. Also at Chancellor, Mr. Moeller worked as an equity analyst and was responsible for researching and rating companies in the economically sensitive automobile and housing industries for investment in Chancellor’s equity portfolio. Prior to joining Chancellor, Mr. Moeller was an Economist at Citibank from 1979 to 1984. He also analyzed pricing behavior in the metals industry for the Council on Wage and Price Stability in Washington, D.C. In 1999, Mr. Moeller received the award for most accurate forecast from the Forecasters' Club of New York. From 1990 to 1992 he was President of the New York Association for Business Economists. Mr. Moeller earned an M.B.A. in Finance from Fordham University, where he graduated in 1987. He holds a Bachelor of Arts in Economics from George Washington University.
More Economy in Brief


