 Global| Nov 27 2009
U.S. New Home Sales Struggle Higher
by:Tom Moeller
|in:Economy in Brief
Summary
Though sales of new homes rose 6.2% to 430,000 last month, the gain followed two months of decline. In all, new home sales have risen nearly one-third from the January trough and the October figure exceeded Consensus expectations for [...]
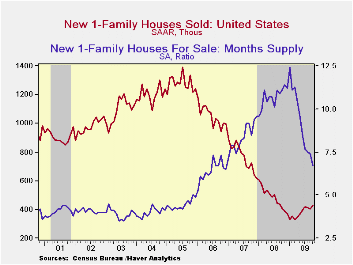 Though sales of new homes rose 6.2% to 430,000 last month, the
gain followed two months of decline. In all, new home sales have risen
nearly one-third from the January trough and the October figure
exceeded Consensus expectations for 405,000 sales.
Though sales of new homes rose 6.2% to 430,000 last month, the
gain followed two months of decline. In all, new home sales have risen
nearly one-third from the January trough and the October figure
exceeded Consensus expectations for 405,000 sales.
Home prices firmed during October for the second consecutive
month. The median price of a new single-family home rose to $212,200
from an upwardly revised September level. The monthly increase pared
the y/y decline to 0.5% from its worst of -14.5% this past February.
The average new home price of $261,100 was off 4.7% y/y.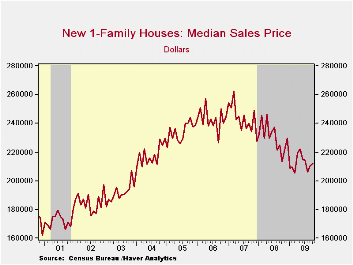
Price discounts, higher sales and much lower housing starts have combined to lower the overhang of unsold homes. It fell by more than one-third versus last year to the lowest level since the early 1970s (again, no typo). The months' supply of unsold homes fell further last month to 6.7 months and was down from the high of 12.4 months in January. The figure was the lowest since December 2006.
| US New Homes | October | September | August | Y/Y | 2008 | 2007 | 2006 |
|---|---|---|---|---|---|---|---|
| Total Sales (SAAR, 000s) | 430 | 405 | 415 | 5.1% | 481 | 769 | 1,049 |
| Northeast | 37 | 39 | 38 | 5.7 | 35 | 64 | 64 |
| Midwest | 56 | 70 | 55 | -11.1 | 69 | 118 | 161 |
| South | 244 | 198 | 212 | 8.4 | 264 | 408 | 559 |
| West | 93 | 98 | 110 | 8.1 | 113 | 178 | 266 |
| Median Price (NSA, $) | 212,200 | 210,700 | 206,300 | -0.5 | 230,408 | 243,742 | 243,067 |
Michigan Consumer Sentiment Improves From Mid-Month
by Tom Moeller November 27, 2009
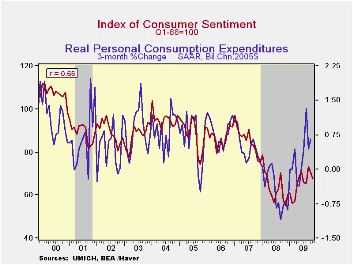 Consumer sentiment during all of November improved from
mid-month to a reading of 67.4 as measured by the Reuters/University of
Michigan Index of Consumer Sentiment. The figure about matched
Consensus expectations. Despite recent declines, sentiment was up by
nearly one-quarter from the lows of last fall. During the last ten
years there has been a two-thirds correlation between the level of
sentiment and the three-month change real consumer spending.
Consumer sentiment during all of November improved from
mid-month to a reading of 67.4 as measured by the Reuters/University of
Michigan Index of Consumer Sentiment. The figure about matched
Consensus expectations. Despite recent declines, sentiment was up by
nearly one-quarter from the lows of last fall. During the last ten
years there has been a two-thirds correlation between the level of
sentiment and the three-month change real consumer spending.
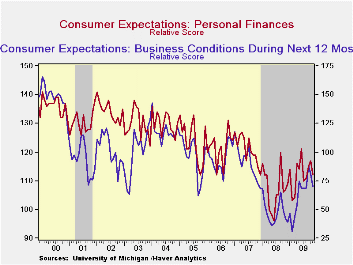
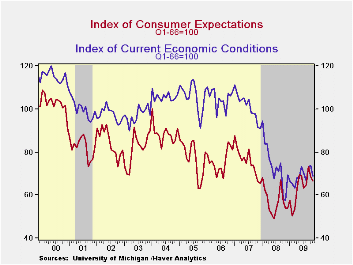 The November reading on expected economic conditions fell to
66.5 from October's 68.6, although it did improve from mid-month. The
primary weakness came in survey participants' outlook for business
conditions over the next year. This move seems to show that the rise in
September was a temporary blip. The reading of expected personal
finances also fell to the lowest since August as more respondents felt
that their personal finances would worsen .
The November reading on expected economic conditions fell to
66.5 from October's 68.6, although it did improve from mid-month. The
primary weakness came in survey participants' outlook for business
conditions over the next year. This move seems to show that the rise in
September was a temporary blip. The reading of expected personal
finances also fell to the lowest since August as more respondents felt
that their personal finances would worsen .
The reading of current economic conditions fell from October and from mid-month. People's assessments of their current financial condition and buying conditions for large household goods both moved down to their lowest since August.
 Expected price inflation during the next year slipped to 3.1%,
down from October's 3.2% but up from the December reading of
1.7%.Respondents' view of government policy, which may eventually
influence economic expectations, improved from October and remained up
significantly from the low of October 2008. Nineteen percent of
respondent thought that a good job was being done by government versus
30% who thought a poor job was being done.
Expected price inflation during the next year slipped to 3.1%,
down from October's 3.2% but up from the December reading of
1.7%.Respondents' view of government policy, which may eventually
influence economic expectations, improved from October and remained up
significantly from the low of October 2008. Nineteen percent of
respondent thought that a good job was being done by government versus
30% who thought a poor job was being done.
The Reuters/University of Michigan survey data are not seasonally adjusted. The reading is based on telephone interviews with about 500 households at month-end. These mid-month results are based on about 320 interviews. The summary indexes are in Haver's USECON database with details in the proprietary UMSCA database.
| University of Michigan | November | Mid-November | October | September | Nov y/y | 2008 | 2007 | 2006 |
|---|---|---|---|---|---|---|---|---|
| Consumer Sentiment | 67.4 | 66.0 | 70.6 | 73.5 | 21.9% | 63.8 | 85.6 | 87.3 |
| Current Conditions | 68.8 | 69.6 | 73.7 | 73.4 | 19.7 | 73.7 | 101.2 | 105.1 |
| Expectations | 66.5 | 63.7 | 68.6 | 73.5 | 23.4 | 57.3 | 75.6 | 75.9 |
U.S. Durable Goods Orders Slip M/M But Trend Improves
by Tom Moeller November 27, 2009
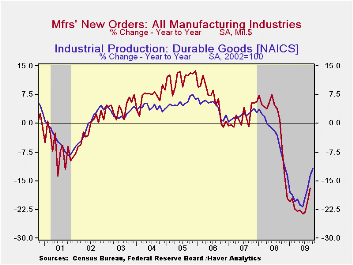 Improvement in factory sector activity was apparent in the
latest orders figures. Durable goods orders slipped 0.6% in October
after an upwardly revised 2.0% rise during September. Despite the
monthly setback, however, the deterioration in factory sector activity
has abated. That is consistent with the recent monthly ISM reports on
manufacturing sector activity. Durable goods orders have risen 5.0%
from their March low and the y/y decline is less than half the worst of
this past winter.
Improvement in factory sector activity was apparent in the
latest orders figures. Durable goods orders slipped 0.6% in October
after an upwardly revised 2.0% rise during September. Despite the
monthly setback, however, the deterioration in factory sector activity
has abated. That is consistent with the recent monthly ISM reports on
manufacturing sector activity. Durable goods orders have risen 5.0%
from their March low and the y/y decline is less than half the worst of
this past winter.
Much of the recent improvement has been due to the
transportation equipment sector where orders rose 1.5% last month
(-13.6% y/y) after an upwardly revised, strong September increase.
Higher orders for aircraft & parts account for most of the
recent gains. Excluding the transportation equipment sector altogether,
orders fell 1.3% during October but they have risen 4.3% from their
April low.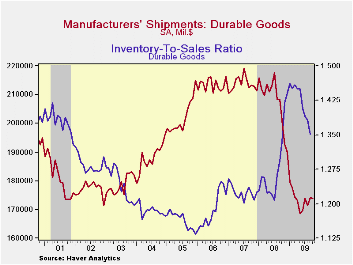
Primary metals orders also continued their recovery with a 3.6% October increase (-13.7% y/y) and they have risen one-quarter from the March low. A 2.7% rise in electrical equipment orders also helped last month's total. They have risen slightly from the spring low after falling by one-third from last year's high. Showing tenuous improvement have been orders for computers & related equipment. While orders remain off their recession low, the gain stalled during the last three months. The same is true for machinery orders.
The capital goods sector also has improved as indicated by a slower year-to-year rate of decline. However, declines in nondefense capital goods orders less aircraft during three of the last four months raises uncertainty about the momentum behind the trend.
Shipments of durable goods slipped 0.2% during October following increases during two of the prior three months. Nevertheless, the y/y decline eased to 13.6% from 20.2% at its worst this spring. The improvement has been paced by firm monthly gains in shipments of metals (-27.9% y/y) but the machinery (-22.9% y/y) and electrical equipment (-20.3% y/y) sectors continue to lag.
Perhaps the shedding of inventories of durable manufactured goods is coming to its end after nearly a year of correction. Inventories were essentially unchanged during October after steep declines in each of the prior nine months. The shedding of inventory has been broad-based led by an 18.6% decline this year in the metals area, a 14.4% drop in computer inventories, a 14.3% drop in motor vehicles and a 13.6% decline in electrical equipment. The recent decline in inventories has been successful in lowering the ratio to shipments to its lowest since November of last year.
The durable goods figures are available in Haver's USECON database.
| NAICS Classification (%) | October | September | August | Y/Y | 2008 | 2007 | 2006 |
|---|---|---|---|---|---|---|---|
| Durable Goods Orders | -0.6 | 2.0 | -2.7 | -11.9 | -5.8 | 1.4 | 6.2 |
| Excluding Transportation | -1.3 | 1.8 | -0.5 | -11.3 | -1.2 | -0.3 | 9.1 |
| Nondefense Capital Goods | 1.2 | 3.2 | -7.8 | -14.1 | -6.8 | 3.5 | 9.4 |
| Excluding Aircraft | -2.9 | 2.6 | -1.0 | -12.8 | -0.3 | -2.7 | 10.7 |

Tom Moeller
AuthorMore in Author Profile »Prior to joining Haver Analytics in 2000, Mr. Moeller worked as the Economist at Chancellor Capital Management from 1985 to 1999. There, he developed comprehensive economic forecasts and interpreted economic data for equity and fixed income portfolio managers. Also at Chancellor, Mr. Moeller worked as an equity analyst and was responsible for researching and rating companies in the economically sensitive automobile and housing industries for investment in Chancellor’s equity portfolio. Prior to joining Chancellor, Mr. Moeller was an Economist at Citibank from 1979 to 1984. He also analyzed pricing behavior in the metals industry for the Council on Wage and Price Stability in Washington, D.C. In 1999, Mr. Moeller received the award for most accurate forecast from the Forecasters' Club of New York. From 1990 to 1992 he was President of the New York Association for Business Economists. Mr. Moeller earned an M.B.A. in Finance from Fordham University, where he graduated in 1987. He holds a Bachelor of Arts in Economics from George Washington University.
More Economy in Brief


