 Global| Nov 26 2019
U.S. New Home Sales Slip in October But from Upwardly Revised Level
by:Sandy Batten
|in:Economy in Brief
Summary
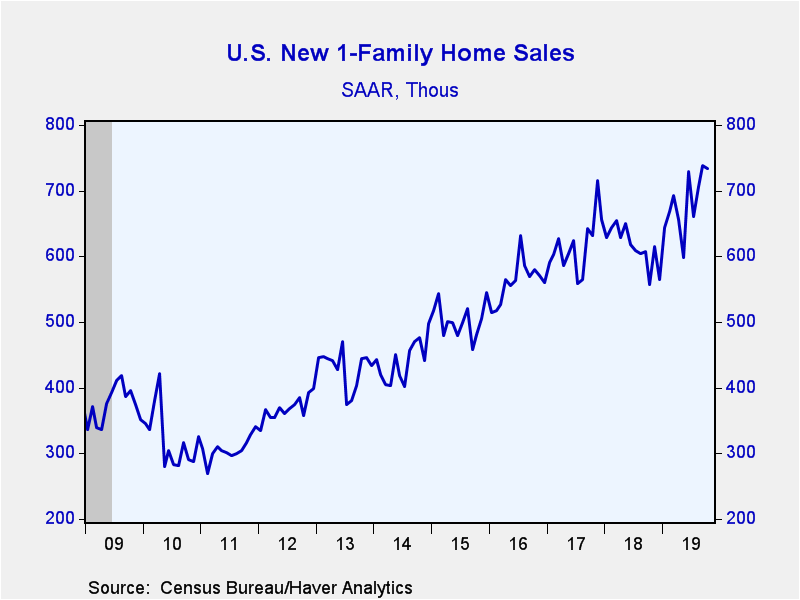
Sales of new single-family homes slipped 0.7% m/m (+31.6% y/y) in October to 733,000 units SAAR. However, the 0.7% m/m decline to 701,000 initially reported for September was revised up significantly to a 4.5% m/m rise to 738,000 [...]
Sales of new single-family homes slipped 0.7% m/m (+31.6% y/y) in October to 733,000 units SAAR. However, the 0.7% m/m decline to 701,000 initially reported for September was revised up significantly to a 4.5% m/m rise to 738,000 SAAR. The Action Economics survey had expected sales of 710,000 in October. So, even though sales slipped in October, the marked upward revision to September meant that the level of sales in October was well above expectations. These sales are recorded when contracts are signed or deposits are made.
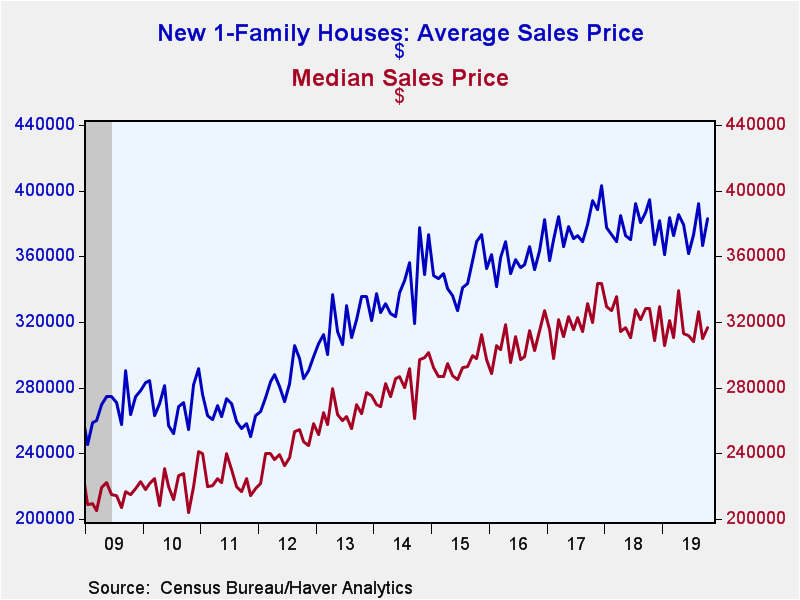
The median price of a new home rose 2.1% m/m (-3.5% y/y) to $316,700 in October with upward revisions to prices in both September and August. The median price is still 7.8% below the record high of $343,400 in November 2017. The average price of a new home increased 4.5% m/m (-2.9% y/y) to $383,300.
Sales were mixed across the country last month versus September. In October, sales fell in the Northeast and the South, edged up in the Midwest and rose meaningfully in the West. Northeast sales were down 18.2% m/m to 27,000 units. Sales in the South fell 3.3% m/m to 436,000 in October, but the 451,000 of sales in September was the highest since mid-2007. In contrast, sales in the Midwest rose 4.2% m/m to 75,000 and sales in the West gained a solid 7.1% m/m to 195,000.
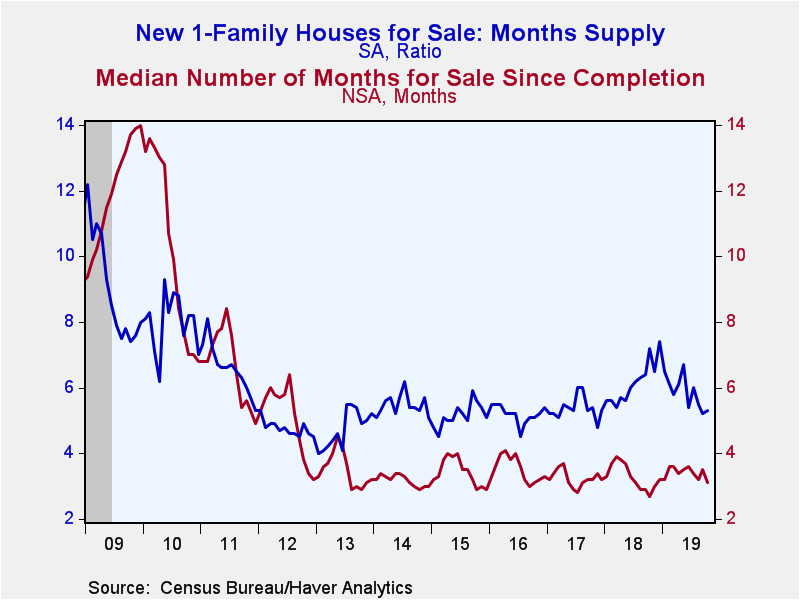
The months' supply of homes on the market edged up to 5.3 months in October from 5.2 months in September, but remained well below the recent high of 7.4 months reached in December 2018. The median number of months a new home was on the market after its completion fell sharply to 3.1 months in October, its lowest in nearly a year, from 3.5 months in September.
The data in this report are available in Haver's USECON database. The consensus expectation figure from Action Economics is available in the AS1REPNA database.
| U.S. New Single-Family Home Sales (SAAR, 000s) | Oct | Sep | Aug | Oct Y/Y % | 2018 | 2017 | 2016 |
|---|---|---|---|---|---|---|---|
| Total | 733 | 738 | 706 | 31.6 | 615 | 617 | 562 |
| Northeast | 27 | 33 | 32 | 17.4 | 32 | 40 | 32 |
| Midwest | 75 | 72 | 63 | 17.2 | 75 | 72 | 69 |
| South | 436 | 451 | 424 | 40.6 | 348 | 341 | 318 |
| West | 195 | 182 | 187 | 21.9 | 160 | 164 | 142 |
| Median Price (NSA, $) | 316,700 | 310,200 | 326,700 | -3.5 | 323,125 | 321,633 | 306,500 |
Sandy Batten
AuthorMore in Author Profile »Sandy Batten has more than 30 years of experience analyzing industrial economies and financial markets and a wide range of experience across the financial services sector, government, and academia. Before joining Haver Analytics, Sandy was a Vice President and Senior Economist at Citibank; Senior Credit Market Analyst at CDC Investment Management, Managing Director at Bear Stearns, and Executive Director at JPMorgan. In 2008, Sandy was named the most accurate US forecaster by the National Association for Business Economics. He is a member of the New York Forecasters Club, NABE, and the American Economic Association. Prior to his time in the financial services sector, Sandy was a Research Officer at the Federal Reserve Bank of St. Louis, Senior Staff Economist on the President’s Council of Economic Advisors, Deputy Assistant Secretary for Economic Policy at the US Treasury, and Economist at the International Monetary Fund. Sandy has taught economics at St. Louis University, Denison University, and Muskingun College. He has published numerous peer-reviewed articles in a wide range of academic publications. He has a B.A. in economics from the University of Richmond and a M.A. and Ph.D. in economics from The Ohio State University.


