 Global| Feb 24 2010
U.S. New Home Sales Plumb Record Low, Weather or Not?
by:Tom Moeller
|in:Economy in Brief
Summary
Whether record snowfall this season hurt housing activity is tough to say. This morning's report that new home sales fell 11.2% from December to 309,000 (AR) following that month's moderate decline suggests that it did, but January [...]
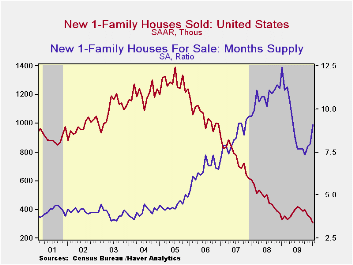 Whether
record snowfall this season hurt housing activity is tough to say. This
morning's report that new home sales fell 11.2% from December to
309,000 (AR) following that month's moderate decline suggests that it
did, but January single-family housing starts were reported last week
to have risen. Perhaps builders have thicker skin than buyers? It
remains to be seen. Nevertheless, January sales fell well short of
Consensus expectations for 355,000 and reached a record low for the
series which dates back to 1963.
Whether
record snowfall this season hurt housing activity is tough to say. This
morning's report that new home sales fell 11.2% from December to
309,000 (AR) following that month's moderate decline suggests that it
did, but January single-family housing starts were reported last week
to have risen. Perhaps builders have thicker skin than buyers? It
remains to be seen. Nevertheless, January sales fell well short of
Consensus expectations for 355,000 and reached a record low for the
series which dates back to 1963.
The one-third m/m drop in home sales in the Northeast certainly suggests a strong weather factor after they rose sharply during December. Conversely, Mid-West sales rose 2.1% following their sharp December decline. In the West, sales drifted lower and neared their record low while sales in the South fell for the fifth month in the last six.
 Home prices
also were quite weak last month posting a 5.6% decline from December to
$203,500. Prices fell 2.4% during the last twelve months to the lowest
level since late-2003. Since the 2007 peak prices have fallen
22.5%.
Home prices
also were quite weak last month posting a 5.6% decline from December to
$203,500. Prices fell 2.4% during the last twelve months to the lowest
level since late-2003. Since the 2007 peak prices have fallen
22.5%.
Price discounts had been lowering the inventory of unsold homes, but weakness in sales and stable starts recently have lifted the inventory to its highest level since May. The months' supply of unsold homes also has increased to 11.1 months from its July low of 7.2 months though that remained down from the high of 12.4 months in January '09. Despite the shrinkage of inventory, it still took a record median 13.9 months to sell a new home as of December.
Fed Chairman Ben S. Bernanke's Semiannual Monetary Policy Report to the Congress can be found here.
| US New Homes | January | December | November | Y/Y | 2009 | 2008 | 2007 |
|---|---|---|---|---|---|---|---|
| Total Sales (SAAR, 000s) | 309 | 348 | 362 | -6.1% | 372 | 481 | 769 |
| Northeast | 24 | 37 | 30 | -20.0 | 31 | 35 | 64 |
| Midwest | 49 | 48 | 68 | -7.5 | 54 | 69 | 118 |
| South | 162 | 179 | 187 | -10.5 | 201 | 264 | 409 |
| West | 74 | 84 | 77 | 13.8 | 87 | 113 | 178 |
| Median Price (NSA, $) | 203,500 | 215,600 | 219,100 | -2.4 | 213,567 | 230,408 | 243,742 |

Tom Moeller
AuthorMore in Author Profile »Prior to joining Haver Analytics in 2000, Mr. Moeller worked as the Economist at Chancellor Capital Management from 1985 to 1999. There, he developed comprehensive economic forecasts and interpreted economic data for equity and fixed income portfolio managers. Also at Chancellor, Mr. Moeller worked as an equity analyst and was responsible for researching and rating companies in the economically sensitive automobile and housing industries for investment in Chancellor’s equity portfolio. Prior to joining Chancellor, Mr. Moeller was an Economist at Citibank from 1979 to 1984. He also analyzed pricing behavior in the metals industry for the Council on Wage and Price Stability in Washington, D.C. In 1999, Mr. Moeller received the award for most accurate forecast from the Forecasters' Club of New York. From 1990 to 1992 he was President of the New York Association for Business Economists. Mr. Moeller earned an M.B.A. in Finance from Fordham University, where he graduated in 1987. He holds a Bachelor of Arts in Economics from George Washington University.
More Economy in Brief


