 Global| Aug 23 2018
U.S. New Home Sales Fall but Prices Increase
by:Tom Moeller
|in:Economy in Brief
Summary
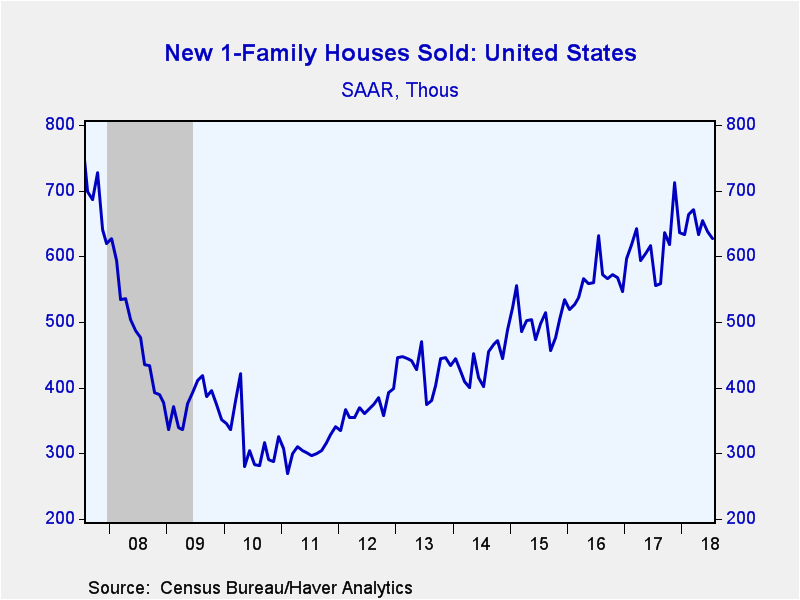
The market for new homes varied greatly last month. New single-family home sales declined 1.7% (+12.8% y/y) during July to 627,000 (AR) after a 2.4% June fall to 638,000, revised from 631,000. It remained the lowest level of sales [...]
The market for new homes varied greatly last month. New single-family home sales declined 1.7% (+12.8% y/y) during July to 627,000 (AR) after a 2.4% June fall to 638,000, revised from 631,000. It remained the lowest level of sales since October and was down from November's high of 712,000. Expectations had been for 648,000 sales in the Action Economics Forecast Survey. Sales are calculated when contracts are closed and are tabulated by the National Association of Realtors.
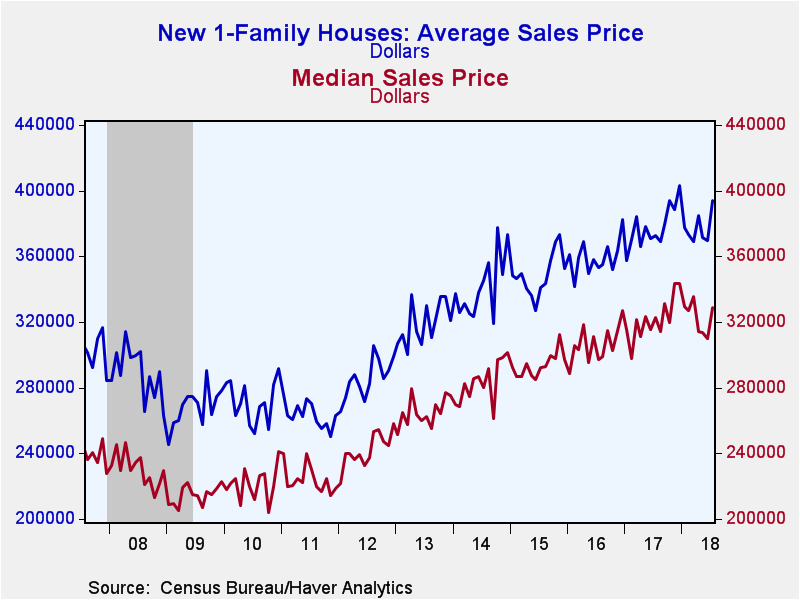
The median price of a new home strengthened 6.0% to $328,700 (-4.2% y/y) from $310,000, revised from $302,100. It was the highest price since March. The average price of a new home increased 6.7% (5.9% y/y) to $394,300, the highest price since December.
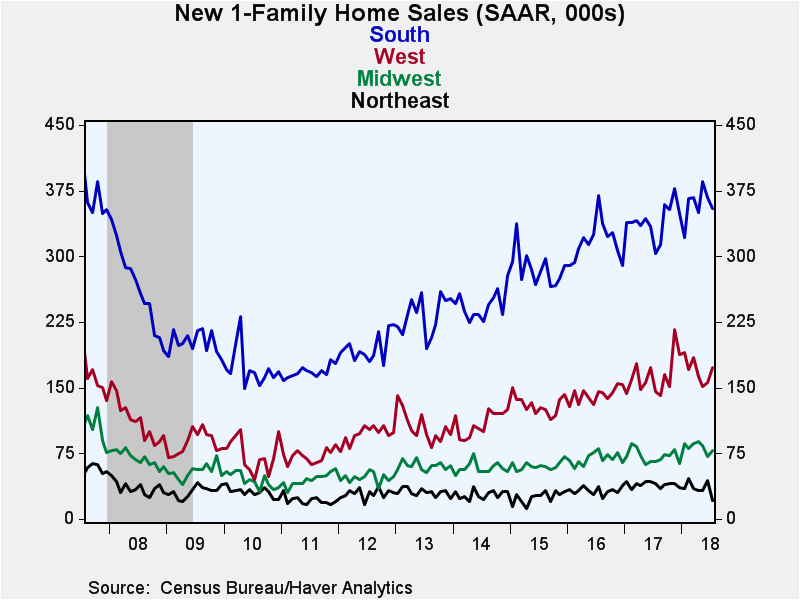
New home sales were mixed last month throughout the country. Home sales in the Northeast fell by roughly one-half both m/m and y/y to 21,000. In the South, new home sales eased 3.3% (+17.2% y/y) to 355,000, a three-month low. New home sales in the West gained 10.9% (18.5%) to 173,000, a four-month high. In the Midwest sales rose 9.9% (18.2% y/y) to 78,000 and made up most of the decline during June.
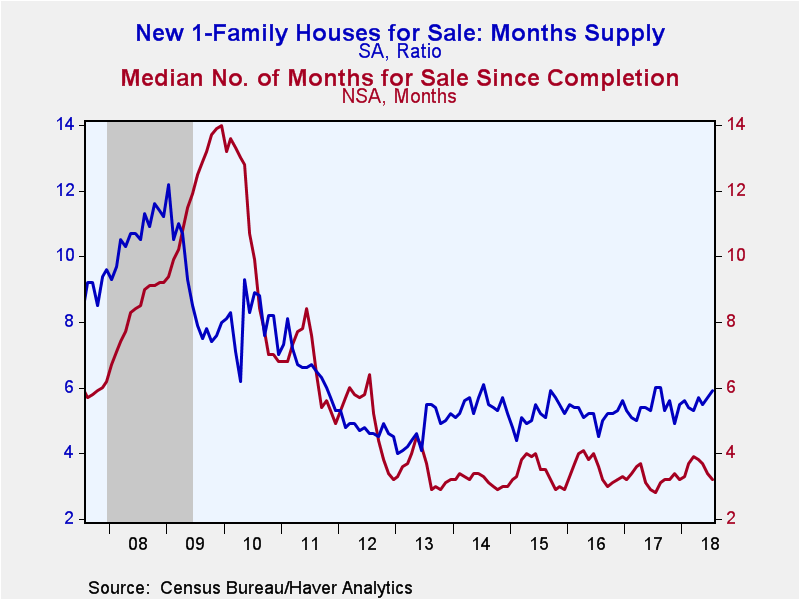
The months' supply of homes on the market rose m/m to 5.9, the highest level since August. The median number of months a new home was on the market fell to 3.2, the lowest point since December.
The data in this report are available in Haver's USECON database. The consensus expectation figure from Action Economics is available in the AS1REPNA database.
Where We Stand: Assessment of Economic Conditions and Implications for Monetary Policy from Robert S. Kaplan, President and CEO, Federal Reserve Bank of Dallas is available here.
| U.S. New Single-Family Home Sales (SAAR, 000s) | Jul | Jun | May | Jul Y/Y % | 2017 | 2016 | 2015 |
|---|---|---|---|---|---|---|---|
| Total | 627 | 638 | 654 | 12.8 | 616 | 560 | 502 |
| Northeast | 21 | 44 | 33 | -48.8 | 40 | 32 | 25 |
| Midwest | 78 | 71 | 84 | 18.2 | 72 | 69 | 61 |
| South | 355 | 367 | 386 | 17.2 | 341 | 317 | 286 |
| West | 173 | 156 | 151 | 18.5 | 164 | 142 | 130 |
| Median Price (NSA, $) | 328,700 | 310,000 | 313,600 | 1.8 | 321,633 | 306,500 | 293,733 |
Tom Moeller
AuthorMore in Author Profile »Prior to joining Haver Analytics in 2000, Mr. Moeller worked as the Economist at Chancellor Capital Management from 1985 to 1999. There, he developed comprehensive economic forecasts and interpreted economic data for equity and fixed income portfolio managers. Also at Chancellor, Mr. Moeller worked as an equity analyst and was responsible for researching and rating companies in the economically sensitive automobile and housing industries for investment in Chancellor’s equity portfolio. Prior to joining Chancellor, Mr. Moeller was an Economist at Citibank from 1979 to 1984. He also analyzed pricing behavior in the metals industry for the Council on Wage and Price Stability in Washington, D.C. In 1999, Mr. Moeller received the award for most accurate forecast from the Forecasters' Club of New York. From 1990 to 1992 he was President of the New York Association for Business Economists. Mr. Moeller earned an M.B.A. in Finance from Fordham University, where he graduated in 1987. He holds a Bachelor of Arts in Economics from George Washington University.
More Economy in Brief
 Global| Feb 05 2026
Charts of the Week: Balanced Policy, Resilient Data and AI Narratives
by:Andrew Cates


