 Global| May 20 2009
U.S. Mortgage Applications Firm As Refinancings Remain High But Purchase Apps Lag
by:Tom Moeller
|in:Economy in Brief
Summary
The week-to-week volatility in mortgage applications can cloud the underlying trends. Such was the case with the latest report from the Mortgage Bankers Association. The bottom line of the latest report is that low interest rates [...]
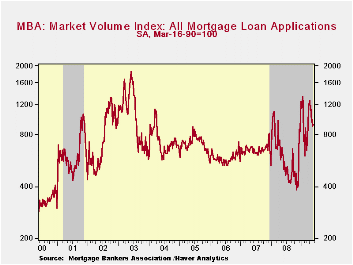
The week-to-week volatility in mortgage applications can cloud the underlying trends. Such was the case with the latest report from the Mortgage Bankers Association. The bottom line of the latest report is that low interest rates continue to spur mortgage refinancings but they have done just little to lift home sales.
Last week, overall mortgage applications recovered roughly one-third of the prior week's decline with a 2.3% increase and applications remained higher by nearly one-half from the year ago level. Despite these increases applications remained down sharply from their early-April peak.
The strength in applications versus last year is wholly the
result of continuing gains in mortgage refinancings. While they have
fallen from the January peak, refinancings last week were more than
double the year-ago level as interest rates remain down sharply. During
last week the index of applications to refinance a home mortgage rose
4.5% and applications this month are still more than double the
year-ago level. 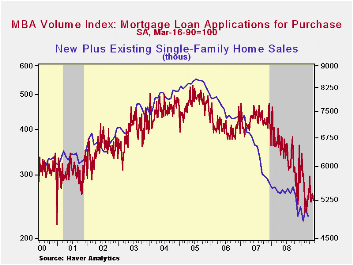
Whatever strength there may be in refinancings is just partially evident in mortgage applications to purchase a home. Purchase applications fell 4.4% from the prior week's level and they remained down by more than one-quarter from the year ago level. The downtrend, however, seems to be bottoming. So far this year purchase applications have moved erratically sideways with a slight upward tilt. That mirrors the trend in new plus existing home sales.
Falling again last week was the effective interest rate on a conventional 15-year mortgage. It dropped to 4.69% from an average that was well over 6.0% last Fall. For a 30-year mortgage rates also were near their recent low at 4.92%. Interest rates on 15- and 30-year mortgages are closely correlated (>90%) with the rate on 10-year Treasury securities. Moving up slightly was the rate for an adjustable 1-Year mortgage to 6.41% from the low close to 6.0% during January. The rate still was down, however, sharply from the 7.07% peak reached this past Fall.
During the last ten years there has been a (negative) 79%
correlation between the level of applications for purchase and the
effective interest rate on a 30-year mortgage. Moreover, during the
last ten years there has been a 61% correlation between the y/y change
in purchase applications and the change in new plus existing single
family home sales.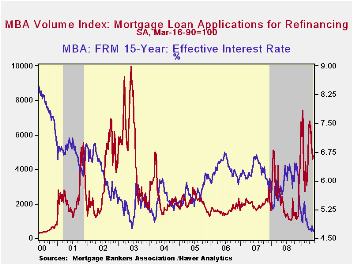
The figures for weekly mortgage applications are available in Haver's SURVEYW database.
The Mortgage Bankers Association surveys between 20 to 35 of the top lenders in the U.S. housing industry to derive its refinance, purchase and market indexes. The weekly survey covers roughly 50% of all U.S. residential mortgage applications processed each week by mortgage banks, commercial banks and thrifts. Visit the Mortgage Bankers Association site here.
The Fed's announcement yesterday concerning the Term Asset-Backed Securities Loan Facility (TALF) can be found here.
Seeking Stability: What’s Next for Banking Regulation? from the Federal Reserve Bank of Dallas is available here.
| MBA Mortgage Applications (3/16/90=100) | 05/15/09 | 05/08/09 | Y/Y | 2008 | 2007 | 2006 |
|---|---|---|---|---|---|---|
| Total Market Index | 915.9 | 895.6 | 47.3% | 642.9 | 652.6 | 584.2 |
| Purchase | 254.0 | 265.7 | -27.9% | 345.4 | 424.9 | 406.9 |
| Refinancing | 4,794.4 | 4,588.6 | 116.9% | 2,394.1 | 1,997.9 | 1,634.0 |
by Robert Brusca May 20, 2009
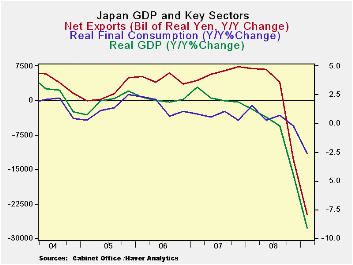
Japan is being led lower by its trade dependence as much as
any large developed country. Exports are lower at a 70% annual rate Q/Q
and by 37% Yr/Yr. Imports meanwhile are dropping at a lesser but still
outsized 47% annual rate in Q1 and are off by nearly 15% Yr/Yr.
Japan’s import to GDP ratio has fallen by 6.2% Yr/Yr less than
in the US where that ratio has fallen by a huge 14%. But exports are a
much larger part of Japan’s economy, so the drop has hurt it more.
Import-to-GDP ratios have fallen sharply among the large developed
economies in general.
Japan’s GDP drop at 15.2% Q/Q saar outstrips Germany’s drop of
14.4% and its Yr/Yr decline of 9.1% exceeds Germany’s 6.9%. It is no
coincidence that these large set backs -- the largest among G-7
countries by a long shot -- befall two of the most highly efficient
global economies that also are highly dependent on trade.
Trade tends to be a highly income elastic GDP component.
Export and import growth rates are pro-cyclical. In good times trade
dependence will help to pump-up GDP growth, but in bad times –
recessions - it will drag it down as it is now. In the US, since it is
a trade deficit county, the trade setback actually boosts GDP. What we
are seeing in Japan is the mirror image of that relationship.
In Japan domestic demand is down by less than GDP itself. But
housing and business capital formation are each down at a more rapid
pace than GDP. Japan will need world trade to recover before it can
mend its economy. Its economic structure means that some of its
required fixing it out of its control.
| Japan GDP | ||||||||||
|---|---|---|---|---|---|---|---|---|---|---|
| Consumption | Capital Formation | Trade Domestic | Domestic | |||||||
| GDP | Private | Public | Gross Fixed Capital |
Plant& Eqpt |
Housing | X-M | Exports | Imports | Demand | |
| % change Q/Q at annual rates of change; X-M is Q/Q change in Billions of real yen | ||||||||||
| Q1-09 | -15.2% | -4.2% | 1.3% | -27.5% | -35.5% | -20.0% | -11.2 | -70.1% | -47.7% | -9.8% |
| Q4-08 | -14.4% | -3.1% | 6.4% | -14.6% | -24.2% | 23.7% | -15.6 | -47.1% | 13.1% | -2.3% |
| Q3-08 | -2.5% | 0.4% | -0.7% | -9.7% | -16.4% | 13.2% | 0.0 | 4.0% | 6.3% | -2.3% |
| Q2-08 | -3.5% | -3.8% | -3.1% | -9.5% | -11.2% | -7.7% | 1.9 | -3.2% | -15.7% | -5.7% |
| % change Yr/Yr; X-M is Yr/Yr change in Gap in Billions of real yen | ||||||||||
| Q1-09 | -9.1% | -2.7% | 0.9% | -15.7% | -22.4% | 0.8% | -24.9 | -36.8% | -14.7% | -5.1% |
| Q4-08 | -4.5% | -0.2% | 0.2% | -7.8% | -12.0% | 11.8% | -13.1 | -12.5% | 2.8% | -1.8% |
| Q3-08 | -0.2% | 0.7% | 0.4% | -4.9% | -4.5% | -5.5% | 4.0 | 4.5% | 0.1% | -1.1% |
| Q2-08 | 0.6% | 0.3% | 0.1% | -3.6% | 0.5% | -16.5% | 6.7 | 6.3% | -2.1% | -0.8% |
| 5-Yrs | -0.4% | 0.5% | 1.2% | -2.8% | -0.7% | -3.5% | na | -2.6% | 0.2% | -0.1% |

Tom Moeller
AuthorMore in Author Profile »Prior to joining Haver Analytics in 2000, Mr. Moeller worked as the Economist at Chancellor Capital Management from 1985 to 1999. There, he developed comprehensive economic forecasts and interpreted economic data for equity and fixed income portfolio managers. Also at Chancellor, Mr. Moeller worked as an equity analyst and was responsible for researching and rating companies in the economically sensitive automobile and housing industries for investment in Chancellor’s equity portfolio. Prior to joining Chancellor, Mr. Moeller was an Economist at Citibank from 1979 to 1984. He also analyzed pricing behavior in the metals industry for the Council on Wage and Price Stability in Washington, D.C. In 1999, Mr. Moeller received the award for most accurate forecast from the Forecasters' Club of New York. From 1990 to 1992 he was President of the New York Association for Business Economists. Mr. Moeller earned an M.B.A. in Finance from Fordham University, where he graduated in 1987. He holds a Bachelor of Arts in Economics from George Washington University.
More Economy in Brief


