 Global| May 05 2011
U.S. Monster Employment Index Hits New High
by:Tom Moeller
|in:Economy in Brief
Summary
The Monster Index rose 6.6% m/m during April following similar, strong gains during the prior two months. The increase raised the latest level 9.0% versus last year and 18.9% from its recent trough. Industry improvement has been [...]
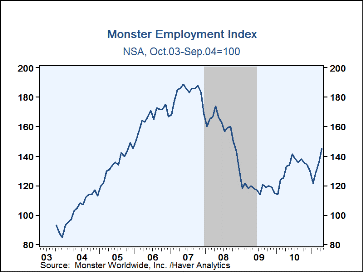
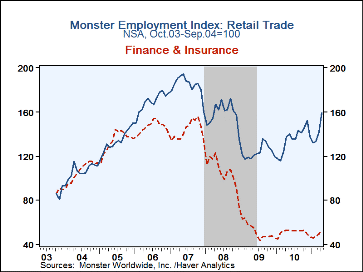
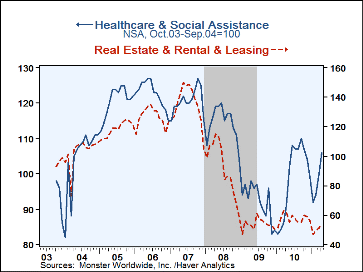
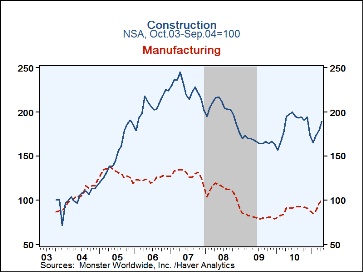
The Monster Index rose 6.6% m/m during April following similar, strong gains during the prior two months. The increase raised the latest level 9.0% versus last year and 18.9% from its recent trough. Industry improvement has been widespread but most notable in the retail trade, professional & scientific and the health care industries. The real estate, construction and the finance & insurance industries have yet to improve meaningfully.
Additional detail by Census region indicates the greatest gains in the East North Central (16.8% y/y), West North Central (16.4% y/y) and East South Central (14.4% y/y) regions followed by the West South Central (10.4%) and South Atlantic regions (9.4% y/y). Moderate growth in the Mountain (5.4%) and Pacific (5.3%) regions was accompanied by a negligible 1.6% gain in New England and a 1.5% decline in the Mid-Atlantic region.
Based on a real-time review of millions of job opportunities culled from more than 1,500 Web sites, including a variety of corporate career sites, job boards and Monster, the Monster Employment Index presents a snapshot of employer online recruitment activity nationwide. The Monster Index counts job postings as an indicator of employer demand for employees or job availability. Job postings are online advertisements placed by an employer looking to fill one or more vacant, or recently created job positions.
The Monster figures date back to October, 2003 and are available in Haver's SURVEYS database.
| Monster Employments Index (2003-2004 = 100) | Apr | Mar | Feb | Y/Y % | 2010 | 2009 | 2008 |
|---|---|---|---|---|---|---|---|
| Overall Index | 145 | 136 | 129 | 9.0 | 132 | 118 | 158 |
| Construction | 189 | 179 | 173 | -3.1 | 186 | 167 | 202 |
| Manufacturing | 100 | 96 | 88 | 9.9 | 89 | 81 | 111 |
| Retail Trade | 159 | 142 | 133 | 16.1 | 135 | 124 | 158 |
| Finance & Insurance | 53 | 50 | 47 | 0.0 | 51 | 52 | 105 |
| Real Estate & Leasing | 54 | 51 | 49 | -12.9 | 58 | 54 | 92 |
| Professional, Scientific & Technical Services | 64 | 61 | 59 | 14.3 | 56 | 53 | 114 |
| Education Services | 94 | 89 | 80 | 5.6 | 88 | 81 | 106 |
| Health Care & Social Services | 106 | 100 | 94 | 16.5 | 99 | 92 | 114 |
| Arts, Entertainment & Recreation | 41 | 38 | 35 | 2.5 | 39 | 40 | 88 |
Tom Moeller
AuthorMore in Author Profile »Prior to joining Haver Analytics in 2000, Mr. Moeller worked as the Economist at Chancellor Capital Management from 1985 to 1999. There, he developed comprehensive economic forecasts and interpreted economic data for equity and fixed income portfolio managers. Also at Chancellor, Mr. Moeller worked as an equity analyst and was responsible for researching and rating companies in the economically sensitive automobile and housing industries for investment in Chancellor’s equity portfolio. Prior to joining Chancellor, Mr. Moeller was an Economist at Citibank from 1979 to 1984. He also analyzed pricing behavior in the metals industry for the Council on Wage and Price Stability in Washington, D.C. In 1999, Mr. Moeller received the award for most accurate forecast from the Forecasters' Club of New York. From 1990 to 1992 he was President of the New York Association for Business Economists. Mr. Moeller earned an M.B.A. in Finance from Fordham University, where he graduated in 1987. He holds a Bachelor of Arts in Economics from George Washington University.


