 Global| Jun 17 2009
U.S. May CPI Ticks Up, But 1.2% Drop Y/Y Is Largest Since April 1950
by:Tom Moeller
|in:Economy in Brief
Summary
The recession continued to weigh on pricing power last month according to the Bureau of Labor Statistics. The May report on consumer prices indicated a less-than-expected rise of 0.1% which followed the unchanged reading for April. [...]
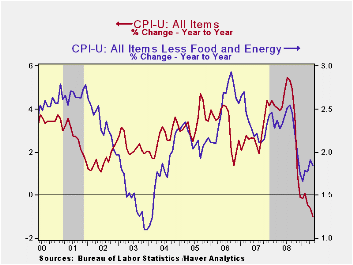
The recession continued to weigh on pricing power last month according to the Bureau of Labor Statistics. The May report on consumer prices indicated a less-than-expected rise of 0.1% which followed the unchanged reading for April. The eye-catching news, however, was that the y/y change of -1.3% was the weakest since early-1950.
Though energy prices have ticked up recently, the decline of 26.3% versus last year is responsible for much of the overall weakness in pricing power. Gasoline prices during May reversed their earlier decline and rose 3.1%, yet they still were down 39.4% y/y. Conversely, fuel oil prices continued downward with a 3.1% drop (-38.1% y/y). The latest was the tenth consecutive monthly drop. Finally, prices for natural gas & electricity have fallen in all but one of the last ten months and year-to-year they are down 5.5%.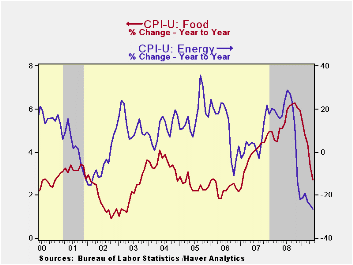
Lower food & beverage prices also continue to restrain overall pricing pressure. Prices slipped for the fourth straight month during May and the y/y gain of 2.7% was the weakest since January 2007. It's down from a peak of 6.1% last fall. Recent weakness has been led by lower dairy product prices (-5.6% y/y). Moreover, price gains for meats, poultry & fish (1.4% y/y), cereals & bakery products (3.5% y/y) as well as fruits & vegetables (-0.8% y/y) have eased sharply.
Finally, "core" pricing remains tame. The CPI less food & energy ticked up just 0.1% last month, the weakest increase this year. So far in 2009, core prices have risen at a 2.3% annual rate. That is up from their recent low; but the annual gain of 1.8% is nearly the smallest since 2004.
So far this year gains in core goods prices actually have firmed versus last year. The 0.2% gain in May capped a five-month stint during which prices rose at a 3.9% annual rate versus a 0.1% uptick during all of last year. While tobacco prices slipped 0.3% last month, higher sales taxes have lifted prices by one-quarter from 2008. There also has been modest firming of prices elsewhere. Prices of new & used motor vehicles have risen at a 4.1% rate during the last five months and the y/y change of -1.1% compares to a rate of decline of 3.5% as of yearend 2008. Prices for household furnishings & operations have risen 1.6% y/y following price deflation early last year. Apparel prices are up 0.8% y/y but that owes almost entirely to a price jump this past February.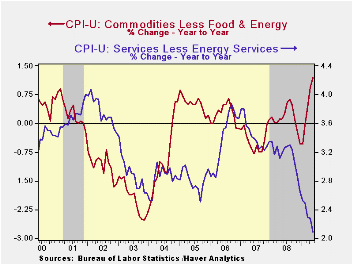
Working the other way, gains in core services prices continue to moderate. The 0.1% uptick last month left the y/y change of 2.3% at its weakest since 1983. So far this year, prices have risen at a 1.6% rate. Weakness in the housing market accounts for much of that moderation. Last month shelter prices ticked up just 0.1% and the annual gain of 1.5% was the weakest since 1983. Owners equivalent rent of primary residence, a measure not equivalent to other house price measures, ticked up just 0.1% (2.1% y/y). Conversely, the increase in medical care services prices of 3.2% y/y is off the low and so far this year prices have risen at a 4.0% rate. Education costs also have been firm and were up 0.5% last month (5.5% y/y). Conversely, public transportation prices have been falling since last summer -9.0% y/y.
The chained CPI, which adjusts for shifts in consumption patterns, gained 0.3% in May while year-to-year prices fell 1.4%. The increase in chained prices less food and energy eased to 0.2% last month.
The consumer price data is available in Haver's USECON database while detailed figures can be found in the CPIDATA database.
Health Care Reform and the Federal Budget from the Congressional Budget Office can be found here.
Why Did FDR's Bank Holiday Succeed? from the Federal Reserve Bank of New York is available here.
| Consumer Price Index (%) | May | April | Y/Y | 2008 | 2007 | 2006 |
|---|---|---|---|---|---|---|
| Total | 0.1 | 0.0 | -1.3 | 3.8 | 2.9 | 3.2 |
| Total less Food & Energy | 0.1 | 0.3 | 1.8 | 2.3 | 2.3 | 2.5 |
| Goods less Food & Energy | 0.2 | 0.5 | 1.2 | 0.1 | -0.4 | 0.2 |
| Services less Energy | 0.1 | 0.2 | 2.1 | 3.1 | 3.4 | 3.4 |
| Energy | 0.2 | -2.4 | -26.3 | 13.5 | 5.7 | 11.0 |
| Food & Beverages | -0.2 | -0.2 | 2.7 | 5.4 | 3.9 | 2.3 |
| Chained CPI: Total (NSA) | 0.3 | 0.3 | -1.4 | 3.3 | 2.5 | 2.9 |
| Total less Food & Energy | -0.0 | 0.2 | 1.4 | 2.0 | 2.0 | 2.2 |
by Tom Moeller June 17, 2009
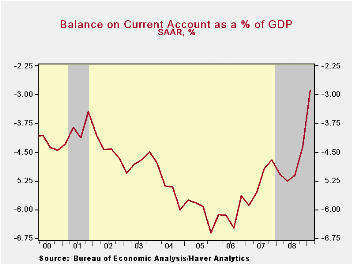
The U.S. current account deficit shrank to its lowest level since 2001 as the recession and lower oil prices limited imports. Despite recessions abroad which lowered U.S. exports, imports fell even more rapidly. The deficit of $101.5 billion was deeper than the Consensus expectation for a reading of $85.0 billion.
As a percentage of GDP, the shrinkage of the U.S. deficit was dramatic. The 2.9% 1Q figure was the smallest since early-1999. This percentage is sharply reduced from the 6.6% peak reached late in 2005.
Recession in the U.S. worked with the decline in oil prices to drop the 1Q deficit on traded goods to $124.0 billion, its lowest since 2004. Though growth in goods exports was a negative 21.0% y/y, imports fell by a greater 30.1% spurred by the drop in oil prices.
Fewer U.S. citizens went abroad this year and more came here. As a result, the balance on services trade narrowed as exports fell more then imports. The 1Q surplus of $32.8 billion compared to a peak surplus of $40.0 billion late during 2007. That decline came as exports fell 7.2% y/y against a 6.4% decline in imports.
From the capital account side of the ledger, the U.S. balance on private direct investment remained stable and slightly positive q/q. That compares with deficits during the last three years. U.S. investment abroad rose while foreign investment here fell sharply.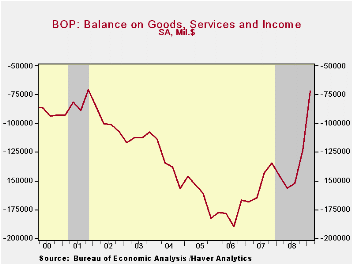
Ties that bind: bilateral trade's role in synchronizing business cycles from the Federal Reserve Bank of Dallas can be found here.
| US Balance of Payments SA | 1Q '09 | 4Q '08 | Year Ago | 2008 | 2007 | 2006 |
|---|---|---|---|---|---|---|
| Current Account Balance ($ Bil.) | -101.5 | -154.9 | -179.3 | -706.1 | -726.6 | -803.5 |
| Deficit % of GDP | 2.9 | 4.4 | 5.1 | 5.0 | 5.3 | 6.1 |
| Balance on Goods ($ Bil.) | -124.0 | -178.8 | -218.8 | -840.3 | -831.0 | -847.3 |
| Exports | -14.2% | -14.0% | -21.0% | 12.2% | 12.1% | 13.8% |
| Imports | -20.4% | -16.0% | -30.1% | 7.5% | 5.7% | 10.7% |
| Balance on Private Services ($ Bil.) | 32.8 | 34.3 | 36.2 | 144.3 | 129.6 | 86.9 |
| Exports | -5.7 | -4.7% | -7.2% | 8.9% | 15.8% | 12.0% |
| Imports | -6.2 | -5.4% | -6.4% | 8.0% | 7.5% | 11.3% |
| Balance on Income ($ Bil.) | 19.3 | 21.1 | 36.7 | 118.2 | 90.8 | 48.1 |
| Unilateral Transfers ($ Bil.) | -29.6 | -31.5 | -33.3 | -128.4 | -116.0 | -91.3 |

Tom Moeller
AuthorMore in Author Profile »Prior to joining Haver Analytics in 2000, Mr. Moeller worked as the Economist at Chancellor Capital Management from 1985 to 1999. There, he developed comprehensive economic forecasts and interpreted economic data for equity and fixed income portfolio managers. Also at Chancellor, Mr. Moeller worked as an equity analyst and was responsible for researching and rating companies in the economically sensitive automobile and housing industries for investment in Chancellor’s equity portfolio. Prior to joining Chancellor, Mr. Moeller was an Economist at Citibank from 1979 to 1984. He also analyzed pricing behavior in the metals industry for the Council on Wage and Price Stability in Washington, D.C. In 1999, Mr. Moeller received the award for most accurate forecast from the Forecasters' Club of New York. From 1990 to 1992 he was President of the New York Association for Business Economists. Mr. Moeller earned an M.B.A. in Finance from Fordham University, where he graduated in 1987. He holds a Bachelor of Arts in Economics from George Washington University.
More Economy in Brief


