 Global| Apr 14 2008
U.S. March Retail Sales Remained Weak
by:Tom Moeller
|in:Economy in Brief
Summary
U.S. retail sales during March increased a modest 0.2% after a 0.4% decline during February. The February drop was a bit shallower than the -0.6% reported last month due to a lessening of that month's decline in sales of motor [...]
U.S. retail sales during March increased a modest 0.2% after a 0.4% decline during February. The February drop was a bit shallower than the -0.6% reported last month due to a lessening of that month's decline in sales of motor vehicles & parts. On a three month basis overall retail sales rose a negligible 0.7% through (AR) March. No change in March sales had been the consensus expectation.
Sales of motor vehicles & parts ticked up just 0.2% (-3.5% y/y) following February's revised 1.4% downdraft.
During March, retail sales excluding autos
ticked up just 0.1% last month and reversed a little revised 0.1%
February dip. So far this year the gain in nonauto retail sales
amounted to 1.8% (AR) following a 4.5% rise last year.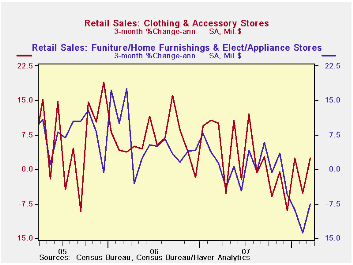 A
0.1 % uptick in nonauto sales had been the consensus expectation.
A
0.1 % uptick in nonauto sales had been the consensus expectation.
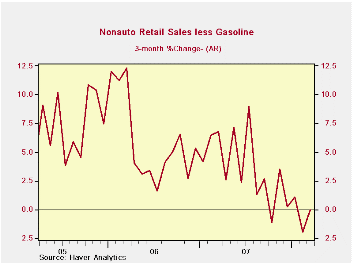
Retail sales less gasoline & autos fell very slightly and were up 1.3% from a year earlier. On a three month basis these sales are roughly unchanged following the 4.4% rise last year. Sales at gasoline service stations rose 1.1% (18.9% y/y).
Sales of discretionary items remained quite weak. Furniture, home furnishings & appliance store sales fell 0.4% (-3.2% y/y). The level of these sales peaked last November and has fallen 4.0% since. Sales of electronics & appliances fell 0.4% (+1.2% y/y) after no change in February which initially was reported as a slight decline. Apparel store sales fell by 0.5% (-1.6% y/y) after a 0.9% (-1.6% y/y) February decline. These sales peaked last July and have since fallen 2.3%. Sales at general merchandise stores fell 0.6% (-0.0% y/y) and are 0.7% off last December's peak.
Building materials & garden equipment sales dropped
another 1.6% (-6.9% y/y) and since their peak early in 2006 these sales
are down 9.6%.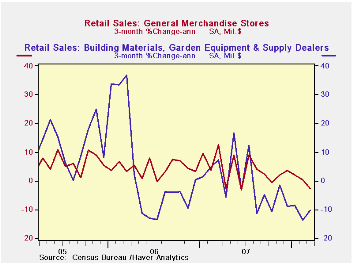
March sales of nonstore retailers (internet & catalogue) were one of the only areas of strength and they posted a firm 2.1% (8.7% y/y) increase after upwardly revised, slight increases in the prior two months.
Food & beverage store sales rose 0.3% (3.9% y/y) last month.
Senior Supervisors Group Releases Report on Disclosure Practices from the Federal Reserve Bank of New York can be found here.
| March | February | Y/Y | 2007 | 2006 | 2005 | |
|---|---|---|---|---|---|---|
| Retail Sales & Food Services | 0.2% | -0.4% | 2.0% | 4.0% | 6.2% | 6.6% |
| Excluding Autos | 0.1% | -0.1% | 3.3% | 4.5% | 7.4% | 7.6% |
| Less Gasoline | -0.0% | -0.1% | 1.3% | 4.4% | 7.2% | 6.6% |
by Tom Moeller April 14, 2008
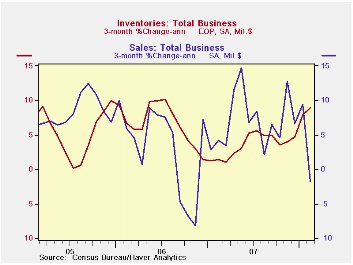
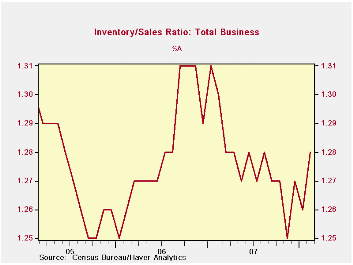
During February, total business inventories matched expectations and rose 0.6%. That followed a 0.9% January increase which was revised up slightly. The annualized three month growth in inventories rose to a quite firm annualized rate of 8.9%, the strongest since mid-2006.
Factory inventories continued to lead the quickened rate of
accumulation. February inventories increased 0.5% following the very
strong 1.3% January surge. The three month rate of accumulation
remained double digit at 11.3% versus 7.2% during 4Q07 and 2.5% in 3Q.
Higher oil prices continued behind some of that faster rate of gain.
Petroleum inventories rose at a 60.7% rate over the last three months.
But elsewhere accumulation also has been strong. Excluding petroleum,
factory inventories rose at an 8.4% rate over the last three months
versus 5.9% growth during 4Q and 1.7% in 3Q.
Retail inventories ticked up just 0.2% in February and three month growth remained subdued at 2.1%. Inventories of motor vehicle & parts during the last three months fell at a 3.3% rate due to production cutbacks. Outside of autos, retail inventories rose just 0.1%. The three month growth of 4.7% wasn't far off the pace of the last few years.
The industry detail in the retail sector indicated that furniture inventories fell for the fourth straight month and at an annual rate of 4.1% during the last three months. Clothing & accessory store inventories have been held under control and fell 0.4% after a large 0.7% January drop. The three month rate of change fell to a negative 2.2% rate. General merchandise stores' inventories need some further reining back. Though they rose just 0.2% in February, over the last three months they're up at an 8.1% rate after little change last year.
The gain in wholesale inventories continued strong at 1.1% in February and at a 51.7% rate during the last three months. Less petroleum, where inventory accumulation has been inordinately strong, wholesale inventory accumulation still has been very firm at a 13.4% rate over the last three months after 4.9% growth last year.
Total business sales fell 1.1% and three month growth went to a negative 1.7%. As a result of sales weakness and firm inventory accumulation the I/S ratio rose to 1.28 in February but that was still level with all of last year and before.
| Business Inventories | February | January | Y/Y | 2007 | 2006 | 2005 |
|---|---|---|---|---|---|---|
| Total | 0.6% | 0.9% | 5.2% | 4.0% | 5.8% | 6.2% |
| Retail | 0.2% | 0.3% | 3.0% | 3.0% | 3.2% | 2.8% |
| Retail excl. Auto | 0.1% | 0.2% | 2.7% | 3.3% | 4.5% | 4.5% |
| Wholesale | 1.1% | 1.3% | 7.4% | 5.5% | 8.3% | 7.3% |
| Manufacturing | 0.5% | 1.3% | 5.5% | 3.7% | 6.4% | 8.9% |
by Louise Curley April 14, 2008
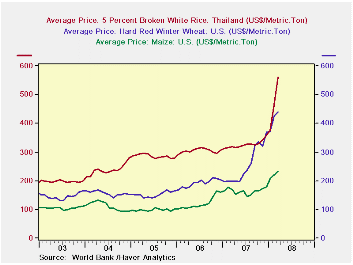
Rice is the latest grain to hit the headlines. Prices of corn,
wheat and rice are shown in the first chart. The rise in the price of
rice is due in part to increasing consumption and in part to the
recent, exceptionally cold winter in China and other parts of Asia.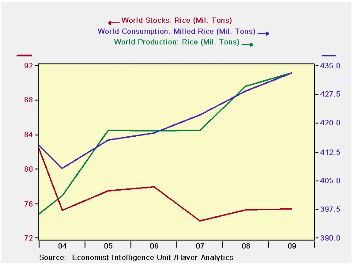
With rice the mainstay of half the world's population, its recent increase in price is causing riots in Asia, Africa and South America. The rise in price is leading to a reduction in import tariffs among those countries desperate for increased supplies of rice and the imposition of export taxes in those rice producing countries anxious to assure supplies for their own citizens. It is also responsible for a reduction in European and U. S. agricultural subsidies since the subsidies vary inversely with world prices.
Haver Analytics has a number of data bases where the prices, production, consumption and stocks of rice may be found. In USECON, the series PRFRICE, gives the monthly dollar price of a hundred weight of rice received by U. S. farmers. The data base, WBPRICES, gives the monthly and annual data for the dollar value of a metric ton of rice. (The first chart shows these data for rice, wheat and corn.) The IFS data base also reports a dollar value of a metric ton of rice, but this series lags the World Bank series. One can compute the export price of rice from Vietnam by dividing the value of rice exports (N528IXI)@EMERGEPR by the volume (N528IJR@EMERGEPR). The Market Indicators and Forecasts of the Economist Intelligence Unit (EIU DATA BASE) have quarterly and annual data on the price of rice and annual data on production, consumption and stocks of rice as shown in the second chart.
| RICE | Mar 08 | Feb 08 | Mar 07 | M/M Chg | Y/Y Chg | 2007 | 2006 | 2005 |
|---|---|---|---|---|---|---|---|---|
| World Bank Price ($ per metric ton) | 561.8 | 464.8 | 318.7 | 20.87 | 76.28 | 326.4 | 304.9 | 286.3 |
| Price of Rice Exports in
Vietnam * ($ per metric ton) |
440.0 | 395.0 | 322.2 | 11.39 | 36.55 | 321.4 | 272.7 | n.a. |
| Price Received by Farmers in U.
S. ($ per cwt) |
12.90 | 12.50 | 10.00 | 3.20 | 29.00 | 10.26 | 8.65 | 7.02 |
| Feb 08 | Jan 08 | Feb 07 | M/M Chg | Y/Y Chg | 2007 | 2006 | 2005 | |
| IFS Price ($ per metric ton) | 481.14 | 393.48 | 316.05 | 22.28 | 52.24 | 332.29 | 303.51 | 282.81 |
| * Computed | ||||||||
| n.a. not available | ||||||||
by Robert Brusca April 14, 2008
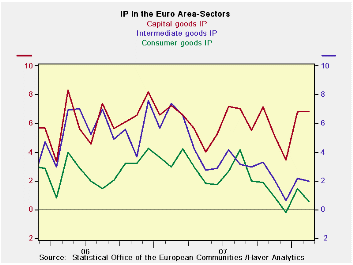
The e-Zone is showing some loss in momentum particularly among
consumer goods and intermediate goods industries. Capital goods
momentum has remained in tact albeit with hints of weakness in its
recent volatility. In the quarter to date (Jan and Feb) growth is still
running at a strong 6% annual rate compared to Q4 of 2007. But consumer
goods output was negative in February and its Q1 growth rate is 2.2%.
Intermediate goods output rose by 0.5% in February and it up at a 5.3%
pace in Q1. Capital goods output is up by a strong 13.3% pace. Germany
continues to post very strong IP figures but these belie some recent
weakness in German orders. So far the Euro Area shows only scattered
signs of slowing despite some dips in morale and a still-rising euro
exchange rate.
| E-zone and UK IP and MFG | ||||||||||
|---|---|---|---|---|---|---|---|---|---|---|
| Saar except m/m | Mo/Mo | Feb 08 |
Jan 08 |
Feb 08 |
Jan 08 |
Feb 08 |
Jan 08 |
|||
| Euro Area Detail | Feb 08 |
Jan 08 |
Dec 07 |
3Mo | 3Mo | 6mo | 6mo | 12mo | 12mo | Q-2 Date |
| Manufacturing | 0.3% | 1.1% | 0.2% | 6.7% | 3.4% | 1.0% | 3.1% | 2.9% | 3.1% | 6.0% |
| Consumer Goods | -0.5% | 0.8% | 0.0% | 1.6% | 1.4% | -2.4% | 1.6% | 0.6% | 1.4% | 2.2% |
| Consumer Durables | -0.4% | 2.4% | -0.2% | 7.5% | 1.1% | -7.7% | -0.3% | -0.7% | 0.5% | -- |
| Consumer Nondurables | -0.4% | 0.5% | 0.1% | 1.0% | 1.9% | -1.7% | 2.1% | 0.9% | 1.7% | -- |
| Intermediate Goods | 0.5% | 0.7% | 0.6% | 7.4% | 2.1% | 0.5% | 2.1% | 2.0% | 2.2% | 5.3% |
| Capital Goods | 0.9% | 2.4% | -0.3% | 12.8% | 8.1% | 5.6% | 6.9% | 6.9% | 6.8% | 13.3% |
| Main E-zone Countries and UK IP in MFG | ||||||||||
| Mo/Mo | Feb 08 |
105.9 | Feb 08 |
105.9 | Feb 08 |
105.9 | ||||
| MFG Only | Feb08 | Jan-08 | Dec 07 |
3Mo | 3Mo | 6mo | 6mo | 12mo | 12mo | Q-2 Date |
| Germany: | 0.3% | 1.0% | 1.7% | 12.6% | 10.5% | 6.1% | 9.7% | 6.3% | 6.9% | 11.1% |
| France: IP excl Construction | 0.3% | 0.6% | 0.7% | 6.3% | -1.5% | 1.1% | 1.0% | 2.0% | 2.9% | 3.0% |
| Italy | -0.3% | 1.8% | 0.0% | 6.1% | 1.7% | -5.2% | -1.9% | -1.9% | -2.3% | 5.8% |
| Spain | 2.5% | 3.2% | -0.7% | 21.7% | -10.2% | 5.5% | 0.7% | 4.1% | -1.1% | 10.9% |
| UK | 0.4% | 0.5% | -0.2% | 2.7% | 0.4% | 1.0% | 0.6% | 2.0% | 0.7% | 2.3% |

Tom Moeller
AuthorMore in Author Profile »Prior to joining Haver Analytics in 2000, Mr. Moeller worked as the Economist at Chancellor Capital Management from 1985 to 1999. There, he developed comprehensive economic forecasts and interpreted economic data for equity and fixed income portfolio managers. Also at Chancellor, Mr. Moeller worked as an equity analyst and was responsible for researching and rating companies in the economically sensitive automobile and housing industries for investment in Chancellor’s equity portfolio. Prior to joining Chancellor, Mr. Moeller was an Economist at Citibank from 1979 to 1984. He also analyzed pricing behavior in the metals industry for the Council on Wage and Price Stability in Washington, D.C. In 1999, Mr. Moeller received the award for most accurate forecast from the Forecasters' Club of New York. From 1990 to 1992 he was President of the New York Association for Business Economists. Mr. Moeller earned an M.B.A. in Finance from Fordham University, where he graduated in 1987. He holds a Bachelor of Arts in Economics from George Washington University.
More Economy in Brief


