 Global| Apr 11 2008
U.S. March Budget Deficit Shallower, 2008 FYTD Deeper
by:Tom Moeller
|in:Economy in Brief
Summary
The U.S. government ran a budget deficit of $48.1B during March, down from last year's March deficit of $96.3B. Despite that decline, for the first six months of FY08 the government ran a budget deficit of $311.4B, up sharply from [...]
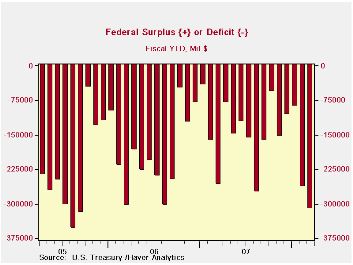
The U.S. government ran a budget deficit of $48.1B during March, down from last year's March deficit of $96.3B. Despite that decline, for the first six months of FY08 the government ran a budget deficit of $311.4B, up sharply from last fiscal year's deficit of $258.4B during the first six months.
For the fiscal year to date, federal receipts grew just 2.2% from a year earlier. That was down sharply from 6.0% growth during the first six months of FY07. The weaker economy and lower stock prices continued to restrain government revenues. Individual income tax receipts (44% of total receipts) grew 5.1% from the first six months of FY07. That was half the y/y growth logged last year. Withheld income taxes grew 5.9%, down from 8.9% last year. Finally, non-withheld taxes grew 5.1%, one third the rate of the first six months of FY07.
Lower corporate profitability hurt government revenues
further. Corporate income taxes (13% of total receipts) amounted to
$158.9B, a 7.1% drop from corporate receipts tallied during the first
six months of FY07. During FY07 they rose 15.4% during the first six
months.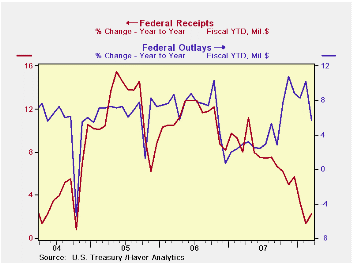
Unemployment insurance contributions fell 6.1% due to negative employment growth and that about repeated the 4.1% decline during the first six months of FY07.
U.S. net outlays grew 5.7% during the first six months of FY08, nearly triple the growth in revenues and double the outlay growth of FY07's first six months. Growth in defense spending (19% of total outlays) totaled 8.5%, up from 6.3% last FYTD but Medicare expenditures (12% of outlays) fell 5.1%. Social security spending (21% of outlays) held about steady at 5.5% and interest expense rose 12.7% as interest rates rose.
The Government's financial data is available in Haver's USECON database.
| US Government Finance | March | February | Y/Y | FY 2007 | FY 2006 | FY 2005 |
|---|---|---|---|---|---|---|
| Budget Balance | -$48.1B | -$175.6B | -$96.3B (3/07) | -$162.0B | -$248.2B | -$318.7B |
| Net Revenues | $178.9 | $105.7B | 7.4% | 6.7% | 11.8% | 14.1% |
| Net Outlays | $227.0 | $281.3B | -13.4% | 2.8% | 7.4% | 7.6% |
by Tom Moeller April 11, 2008
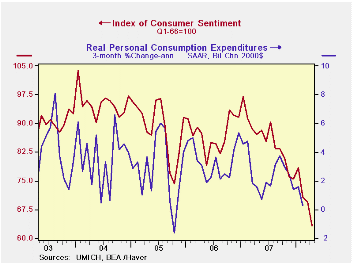
The preliminary reading of April consumer sentiment from the University of Michigan fell another 9.1% m/m to 63.2. Consensus expectations had been for a lesser decline to 69.0. The decline dropped sentiment to near its lowest level since 1982.
The expectations component accounted for the largest part of the decline in April sentiment with an 11.1% m/m drop. The index is at its lowest since 1990. Expectations for personal finances fell out of bed with a 13.4% m/m drop (-23.6% y/y). Expectations for business conditions during the next year also fell a hard 8.7% (-51.7% y/y). Expectations for conditions over the next five years fell 11.1% m/m (-20.0% y/y).
Opinions about government policy, which apparently influence
economic expectations, fell 4.4% m/m (-28.6% y/y). The percentage of
those surveyed who indicated that they thought government was doing a
good job fell to the lowest level since 1992 and 43% had a poor opinion.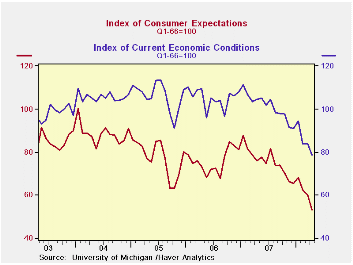
The mean expectation for inflation during the next twelve months rose again last month to 5.6%, nearly the highest level since 1990.
The current conditions index fell 6.9% m/m after a slight rise during March. The view of current conditions for buying large household goods fell hard (-24.3% y/y) and the view of current personal finances also fell sharply (-26.9% y/y).
The University of Michigan survey is not seasonally adjusted.The reading is based on telephone interviews with about 500 households at month-end; the mid-month results are based on about 300 interviews. The summary indexes are in Haver's USECON database, with details in the proprietary UMSCA database.
The Consequences of Mortgage Credit Expansion: Evidence from the 2007 Mortgage Default Crisis from Atif R. Mian and Amir Sufi at the University of Chicago can be found here.
| University of Michigan | April (Prelim.) | March | Feb | April y/y | 2007 | 2006 | 2005 |
|---|---|---|---|---|---|---|---|
| Consumer Sentiment | 63.2 | 69.5 | 70.8 | -27.4% | 85.6 | 87.3 | 88.5 |
| Current Conditions | 78.4 | 84.2 | 83.8 | -25.0% | 101.2 | 105.1 | 105.9 |
| Expectations | 53.4 | 60.1 | 62.4 | -29.6% | 75.6 | 75.9 | 77.4 |
by Tom Moeller April 11, 2008
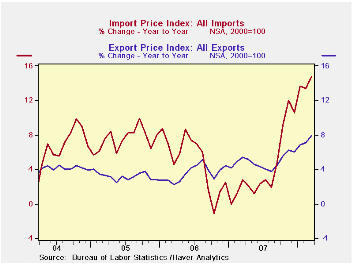
Overall import prices surged 2.8% last month. Except for a 3.2% jump last November, the gain was the largest since 1990 and by far outpaced Consensus expectations for a 0.2% uptick.
Petroleum prices rose 9.1% as crude oil prices surged. Imported crude petroleum prices already are up another 4% this month versus March.
Less petroleum, import prices jumped 1.1%. That was the
largest m/m increase on record, pushed higher by the lower foreign
exchange value of the dollar.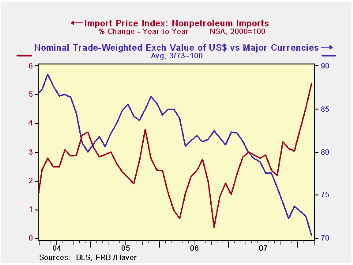
During the last ten years there has been a 66% (negative) correlation between the nominal trade-weighted exchange value of the US dollar vs. major currencies and the y/y change in non oil import prices. The correlation is a reduced 47% against a broader basket of currencies.
Prices for industrial supplies & materials excluding petroleum surged again, last month by 3.6% (14.7% y/y) after the 2.7% February jump. Finished metal prices have been strong (16.1% y/y) and iron & steel mill product prices were up 19.5% y/y. The detailed import price series can be found in the Haver USINT database.
Capital goods import prices rose 1.0% y/y
but less
the lower
prices of computers capital goods prices rose 3.3%, the fastest rate of
gain since 1995. Prices of computers, peripherals and accessories fell
4.5% y/y.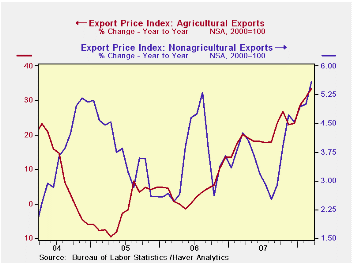
Finally, prices for nonauto consumer goods
imports
rose 2.7%
y/y during March, the quickest gain since 1992. Price gains were
accelerated across the board.
Total export prices also have been quite strong led by a 33.4% y/y surge in agricultural prices. Nonagricultural export prices also were strong and rose 5.6% y/y, the quickest since 1995.
| Import/Export Prices (NSA) | March | February | Y/Y | 2007 | 2006 | 2005 |
|---|---|---|---|---|---|---|
| Import - All Commodities | 2.8% | 0.2% | 14.8% | 4.2% | 4.9% | 7.5% |
| Petroleum | 9.1% | -1.9% | 60.0% | 11.6% | 20.6% | 37.6% |
| Non-petroleum | 1.1% | 0.7% | 5.4% | 2.7% | 1.7% | 2.7% |
| Export- All Commodities | 1.5% | 1.1% | 7.9% | 4.9% | 3.6% | 3.2% |
by Robert Brusca April 11, 2008
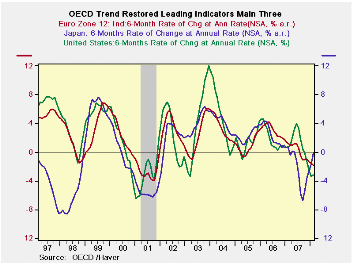
The OECD Leading indicators show weakness on a broad scale
especially when viewed in their preferred habitat as six month
percentage changes. On that basis, however, Japan is showing some more
hopeful readings (increases!) even as Japanese authorities have engaged
in some scenario-shifting leading to downgrading.
The US shows the deepest six-month and three-month signal of deterioration. OECD Europe at -1.8% is not as weak over six months but it shows declines over the recent six month period as well as the previous six month period unlike the US that is very weak in the current six months but had showed expansion over the previous six month period.
Neither the US nor Europe show the depth of decline in this indicator that they did at the time of the last US recession. Japan did touch that level of deterioration but only very briefing. It is now on a sharp reversal course.
| OECD Trend-restored leading Indicators | ||||
|---|---|---|---|---|
| Growth progression-SAAR | ||||
| 3-Mos | 6-Mos | 12-mos | Yr-Ago | |
| OECD | 0.5% | -1.0% | -0.4% | 1.4% |
| OECD7 | -2.6% | -3.0% | -1.5% | 0.4% |
| OECD Europe | -2.4% | -1.8% | -1.2% | 1.7% |
| OECD Japan | 4.5% | 3.1% | -2.2% | 0.7% |
| OECD US | -4.2% | -4.8% | -1.2% | 0.0% |
| Six month readings at 6-Mo Intervals: | ||||
| Recent six | 6-Mo Ago | 12-Mo Ago | 18-Mo Ago | |
| OECD | -1.0% | 0.2% | 2.3% | 0.6% |
| OECD7 | -3.0% | 0.0% | 1.1% | -0.4% |
| OECD Europe | -1.8% | -0.7% | 1.2% | 2.3% |
| OECD Japan | 3.1% | -7.1% | 0.9% | 0.4% |
| OECD US | -4.8% | 2.6% | 1.4% | -1.4% |
| Slowdowns indicated by BOLD RED | ||||

Tom Moeller
AuthorMore in Author Profile »Prior to joining Haver Analytics in 2000, Mr. Moeller worked as the Economist at Chancellor Capital Management from 1985 to 1999. There, he developed comprehensive economic forecasts and interpreted economic data for equity and fixed income portfolio managers. Also at Chancellor, Mr. Moeller worked as an equity analyst and was responsible for researching and rating companies in the economically sensitive automobile and housing industries for investment in Chancellor’s equity portfolio. Prior to joining Chancellor, Mr. Moeller was an Economist at Citibank from 1979 to 1984. He also analyzed pricing behavior in the metals industry for the Council on Wage and Price Stability in Washington, D.C. In 1999, Mr. Moeller received the award for most accurate forecast from the Forecasters' Club of New York. From 1990 to 1992 he was President of the New York Association for Business Economists. Mr. Moeller earned an M.B.A. in Finance from Fordham University, where he graduated in 1987. He holds a Bachelor of Arts in Economics from George Washington University.
More Economy in Brief


