 Global| Feb 22 2008
U.S. Loan Delinquencies Up Across the Board
by:Tom Moeller
|in:Economy in Brief
Summary
During 4Q 2007, the Federal Reserve Board Reported that the delinquency rate on all consumer loan & leases jumped to 2.49% from 2.13% during the third quarter. The latest reading was the highest since early 2003, but that performance [...]
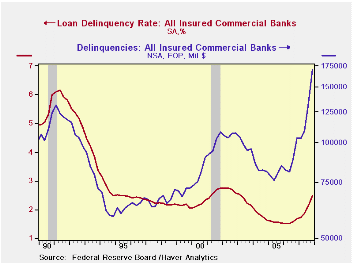
During 4Q 2007, the Federal Reserve Board Reported that the delinquency rate on all consumer loan & leases jumped to 2.49% from 2.13% during the third quarter. The latest reading was the highest since early 2003, but that performance masks some the real troubles being had in making payments.
The dollar value of these loans totaled a record $170 trillion
last quarter, more than double the level at the recent low during 2005.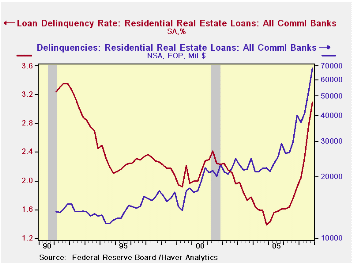
Driving the rise were delinquent payments on residential real estate loans. Delinquent payments on residential real estate loans surged to 3.09% of the loans extended. The current rate is the highest since 1991. Delinquencies on commercial real estate loans, which had been relatively current, jumped. The rate of 2.71% was the highest since late 1996 with a delinquency rate of 2.71%.
The dollar value of those delinquent residential real estate loans jumped to $68.4 trillion (+71.2% y/y), more than four times the level ten years ago and 40% of the dollar value of late payments on banks' books.
Delinquent payments on consumer loans also
rose sharply to a 3.39% rate versus 3.13% for the full year 2007.
Delinquent payments on credit card debt rose to
4.55%, 4.25% for the whole year. The rise for credit card debt was
larger from the low of 3.52% late in 2005.End of the Credit
Line is a 2006 article from the Federal Reserve Bank of
Minneapolis and it can be found
here.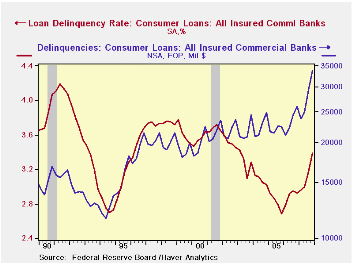
The dollar value of those delinquent credit card payments amounted to $17.4 trillion, nearly triple the low in 1993.
Delinquencies on C&I loans rose slightly q/q to 1.35% from 1.23% during 3Q, up slightly from 2006 but down from years prior.The dollar values of these loans amounted to $18.1 trillion during 4Q, up by more than one third from one year prior.
These data series are available in Haver's USECON database.
Another Widow: The Term Auction Facility from the Federal Reserve Bank of St. Louis is available here.
| Loan Delinquency Rate (%) | 4Q '07 | 3Q '07 | 4Q '06 | 2007 | 2006 | 2005 |
|---|---|---|---|---|---|---|
| Total Loan & Leases | 2.49 | 2.13 | 1.68 | 2.06 | 1.57 | 1.56 |
| Consumer Loans | 3.39 | 3.17 | 2.93 | 3.13 | 2.90 | 2.81 |
| Credit Cards | 4.55 | 4.34 | 3.92 | 4.25 | 4.01 | 3.70 |
| Real Estate Loans | 2.88 | 2.40 | 1.67 | 2.27 | 1.48 | 1.37 |
| Residential | 3.09 | 2.75 | 1.91 | 2.55 | 1.73 | 1.55 |
| Commercial | 2.71 | 1.98 | 1.32 | 1.94 | 1.13 | 1.07 |
| Commercial & Industrial Loans | 1.35 | 1.23 | 1.17 | 1.23 | 1.27 | 1.51 |
by Robert Brusca February 22, 2008
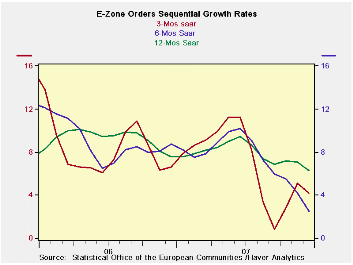
Rising order trends mask encroaching weakness.
Despite a sharp 3.6% drop in orders in December EMU orders are
still rising strongly over three months and a strong 8.5% in the
quarter. Order trends are even turning higher despite the sharp drop in
orders in December. But MFG sales already are very weak and are
declining in the quarter. Domestic orders are clearly weaker than
foreign orders. In the quarter domestic orders are up at nearly a 7%
pace and foreign orders are up at a nearly 14% pace. The country detail
shows that Germany is a major counterbalance to the overall results.
Germany’s orders are up by 20% in the quarter. France, Italy and the UK
are showing orders drop in the fourth quarter.
| E-zone and UK Industrial Orders & Sales Trends | |||||||||
|---|---|---|---|---|---|---|---|---|---|
| Saar except m/m | % m/m | Dec 07 |
Dec 07 |
Dec 07 |
Dec 06 |
Dec 05 |
Qtr-2 Date |
||
| Euro Area Detail | Dec-07 | Nov-07 | Oct-07 | 3Mo | 6mo | 12mo | 12mo | 12mo | Saar |
| MFG Orders | -3.6% | 2.0% | 2.7% | 3.8% | -5.8% | 3.6% | 6.8% | 6.4% | 8.5% |
| MFG Sales | 0.0% | 0.1% | 0.0% | 0.3% | 0.5% | 3.6% | 7.3% | 6.3% | -0.3% |
| Consumer goods | 0.2% | 0.2% | 0.1% | 1.9% | 2.6% | 3.2% | 7.3% | 6.3% | 2.0% |
| Capital goods | -0.1% | -0.1% | 0.1% | -0.4% | 2.1% | 4.7% | 4.7% | 3.2% | 1.1% |
| Intermediate goods | 0.1% | 0.1% | -0.3% | 6.1% | -2.1% | 0.1% | 8.3% | 5.6% | 6.9% |
| MFG Orders | |||||||||
| Total Orders | -3.6% | 2.0% | 2.7% | 3.8% | -5.8% | 3.6% | 6.8% | 6.4% | 8.5% |
| E-13 Domestic MFG orders | -4.6% | 1.9% | 4.5% | 6.1% | -2.1% | 0.1% | 7.4% | -0.7% | 6.9% |
| E-13 Foreign MFG orders | -5.5% | 3.6% | 2.3% | 0.4% | -14.5% | 4.4% | 4.4% | 11.5% | 13.9% |
| Countries: | Dec-07 | Nov-07 | Oct-07 | 3Mo | 6mo | 12mo | 12mo | 12mo | Qtr-2 Date |
| Germany | -2.2% | 3.5% | 4.0% | 22.8% | -3.3% | 10.5% | 8.7% | 5.1% | 20.8% |
| France | -2.0% | -0.3% | 2.2% | -0.3% | -7.0% | 3.8% | 2.7% | 0.5% | -3.8% |
| Italy | -5.4% | 2.9% | -1.1% | -14.1% | -8.8% | 1.6% | 8.1% | 3.6% | -3.3% |
| UK | 5.2% | -4.2% | 2.6% | 14.0% | 7.2% | 13.9% | -2.8% | -2.6% | -20.6% |
by Robert Brusca February 22, 2008
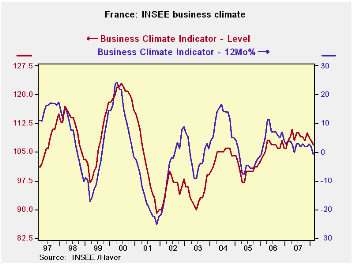
The INSEE industry climate index fell to 107 from 108. The
index stands in the 68th percentile of its range. The recent trend
rates a -14 and stands below its midpoint in the 43rd percentile of its
range.
In the chart we plot the business indicator as an index and as
a percentage change from a year ago. On a percentage basis the level is
falling. On a level basis the erosion is minor.
France has held up longer than most other EMU economies. Its
indicators currently stand at a still strong level but the newest
information is that some of this weakness is beginning to take a toll
in France.
| INSEE Industry Survey | ||||||||||
|---|---|---|---|---|---|---|---|---|---|---|
| Since Jan 1990 | Since Jan 1990 | |||||||||
| Feb-08 | Jan-08 | Dec-07 | Nov-07 | %tile | Rank | Max | Min | Range | Mean | |
| Climate | 107 | 108 | 109 | 110 | 68.0 | 64 | 123 | 73 | 50 | 101 |
| Production | ||||||||||
| Recent Trend | -14 | -6 | 4 | 3 | 43.1 | 134 | 44 | -58 | 102 | -5 |
| Likely trend | 43 | 47 | 44 | 43 | 79.2 | 8 | 63 | -33 | 96 | 8 |
| Orders/Demand | ||||||||||
| Orders & Demand | -1 | -1 | 1 | 4 | 70.1 | 46 | 25 | -62 | 87 | -14 |
| Foreign Orders & Demand | 1 | 0 | 6 | 4 | 66.3 | 67 | 31 | -58 | 89 | -10 |
| Prices | ||||||||||
| Likely Sales Prices Trend | 17 | 12 | 12 | 10 | 85.1 | 12 | 24 | -23 | 47 | 1 |
by Robert Brusca February 22, 2008
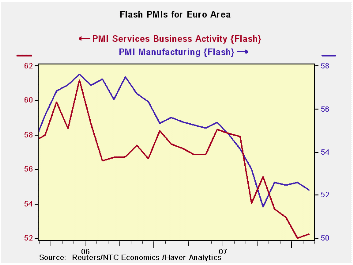
EMU PMIs show continued weakness.
The EMU PMIs were weak in February. The MFG index fell further while the services barometer, already very weak, edged higher. The MFG index is in the 12th percentile of its range over 24 months. Services reside in the bottom 2 percent of their range.The MFG indexes have been slipping since mid-2006. They fell to a lower plateau in early 2007 then fell sharply again as 2007 drew to a close. MFG has steadied above its lowest pace around a MFG reading of 52.The service sector has weakened on roughly the same profile except it did not rebound and steady above its low as 2008 began. Services have made a small rebound in February but continue to cling near the lower reaches of its 24 month range. Europe is continuing to look weak despite this small up-tick in February.
| FLASH Readings | ||
|---|---|---|
| NTC PMIs for the Euro Area | ||
| MFG | Services | |
| Feb-08 | 52.25 | 52.25 |
| Jan-08 | 52.60 | 52.01 |
| Averages | ||
| 3-Mo | 52.44 | 52.50 |
| 6-Mo | 52.43 | 53.47 |
| 12-Mo | 53.73 | 55.51 |
| 24-Mo Range | ||
| High | 57.61 | 61.21 |
| Low | 51.46 | 52.01 |
| % Range | 12.8% | 2.6% |

Tom Moeller
AuthorMore in Author Profile »Prior to joining Haver Analytics in 2000, Mr. Moeller worked as the Economist at Chancellor Capital Management from 1985 to 1999. There, he developed comprehensive economic forecasts and interpreted economic data for equity and fixed income portfolio managers. Also at Chancellor, Mr. Moeller worked as an equity analyst and was responsible for researching and rating companies in the economically sensitive automobile and housing industries for investment in Chancellor’s equity portfolio. Prior to joining Chancellor, Mr. Moeller was an Economist at Citibank from 1979 to 1984. He also analyzed pricing behavior in the metals industry for the Council on Wage and Price Stability in Washington, D.C. In 1999, Mr. Moeller received the award for most accurate forecast from the Forecasters' Club of New York. From 1990 to 1992 he was President of the New York Association for Business Economists. Mr. Moeller earned an M.B.A. in Finance from Fordham University, where he graduated in 1987. He holds a Bachelor of Arts in Economics from George Washington University.
More Economy in Brief


