 Global| Oct 22 2007
U.S. Loan Delinquencies & Foreclosures Soar
by:Tom Moeller
|in:Economy in Brief
Summary
Through the second quarter of this year, delinquent payments on loans at commercial banks in the U.S. has soared to the highest level since 2004. The rate on residential loans is up to the highest since the recession year 2001. The [...]
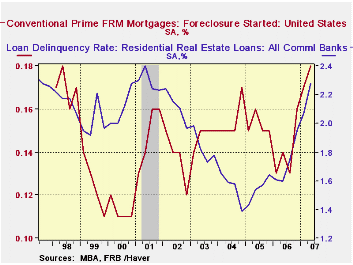
Through the second quarter of this year, delinquent payments on loans at commercial banks in the U.S. has soared to the highest level since 2004. The rate on residential loans is up to the highest since the recession year 2001.
The data are reported quarterly by the U.S. Federal Reserve Board and are available in Haver's USECON database. The numbers for 2Q 07 will be reported in the next few weeks.
Loan delinquency rates are also available from the Mortgage Bankers Association. They too show an increase. All mortgages past due by 30 days number 3.02% of all mortgages versus a low of 2.77% at the end of 2004.
These data are available in Haver's MBAMTG database.
The rise in the loan delinquencies has prompted a huge increase in mortgage foreclosure rates.
While these rates are still low, foreclosure rates on all mortgages in the U.S. have risen to 0.65% from their quarterly low of 0.40% in 2004. For prime fixed rate mortgages foreclosures have risen to 0.18% from the low of 0.12% in 2002.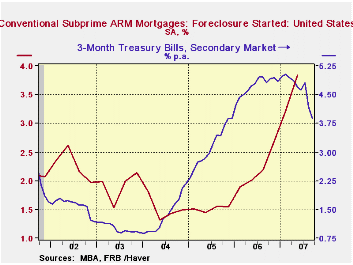
The more dramatic increase has been for adjustable rate mortgages. For conventional adjustable rate mortgages (ARMs) the rise the foreclosure rate is noticeable, but to a still very low level of 0.62% from the low of 0.16% in 2004.
For subprime mortgages, however, the rise in foreclosures has been more dramatic to 2.72% and more than doubled the lowest quarterly rate of 2004. And foreclosure rates on subprime ARMs has about tripled from the quarterly low of 1.32% in 2004. These have clearly followed the past increase in short term interest rates and the latest easing of that rise will (hopefully) lessen the pressure in the mortgage market.Recent Financial Developments and the U.S. Economic Outlook from the Federal Reserve Bank of San Francisco can be found here.
| Delinquency Rate | 2Q 07 | 1Q 07 | 2006 | 2005 | 2004 |
|---|---|---|---|---|---|
| Real Estate Loans | 1.99% | 1.77% | 1.48% | 1.38% | 1.44% |
| Residential | 2.28% | 2.07% | 1.73% | 1.54% | 1.55% |
| Commercial | 1.59% | 1.39% | 1.11% | 1.07% | 1.20% |
| Foreclosure Rate | |||||
| All Mortgages | 0.65% | 0.58% | 1.84% | 1.64% | 1.73% |
| Conventional ARM Mortgages | 0.62% | 0.53% | 0.30% | 0.19% | 0.18% |
| Subprime ARM Mortgages | 3.84% | 3.23% | 2.20% | 1.52% | 1.52% |
by Louise Curley October 22, 2007
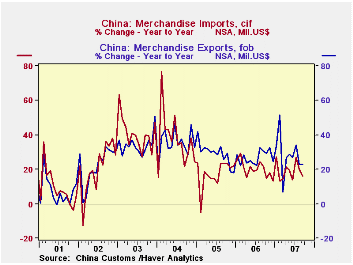
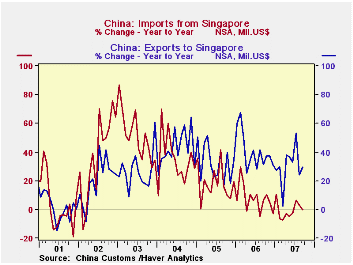
While China's balance of trade on goods has risen steadily, it has been the rise in exports that has captured most attention. Now attention is beginning to the paid to the deceleration in imports that has begun to take place in the last year or so. The year to year monthly increase in imports had generally been greater than that of exports, but in the last year or so, this relationship has been reversed as can be seen in the first chart that shows the year to year increases in exports and imports.
A rise in the yuan could account for some of the recent dampening of imports, but the rise of the yuan so far has been minimal suggesting that other factors may be at work. While outsourcing on the part of the western industrialized countries has led to an increase in China's exports, in the initial stage of the process it raised China's demand for intermediate goods which it had to import. As China increased the sophistication of its own production, the need to import intermediate good diminished and resulted in a growing trade surplus with most western countries. It appears that this process is now taking place with some of the Asian countries, such as South Korea and Singapore that have outsourced production to China. These countries are now experiencing a decline in demand from China for intermediate goods. China's imports from Singapore have very definitely leveled off and those from Korea, somewhat less so. China's exports to Singapore and Korea meanwhile, continue to increase with the result that China's surplus on trade in goods with Singapore has widened and China's deficit on trade with Korea has narrowed. These trends are shown in the second and third charts.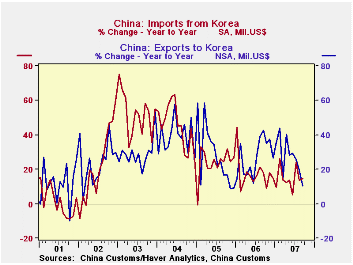
| CHINA'S TRADE Y/Y % CHG. | Sep 07 | Aug 07 | Jul 07 | Jun 07 | May 07 | 2006 | 2005 | 2004 | 2003 |
|---|---|---|---|---|---|---|---|---|---|
| Exports | 22.8 | 22.7 | 34.2 | 27.0 | 28.7 | 27.2 | 28.4 | 35.9 | 34.6 |
| Imports | 16.1 | 20.1 | 26.9 | 14.2 | 19.1 | 19.9 | 17.6 | 36.0 | 40.0 |
| Imports from Singapore | -0.2 | 3.3 | 6.7 | -2.4 | -4.7 | 6.9 | 18.1 | 33.5 | 48.6 |
| Imports from South Korea | 14.7 | 14.6 | 23.8 | 5.6 | 13.4 | 16.8 | 23.7 | 44.0 | 51.0 |
| Exports to Singapore | 29.8 | 24.0 | 53.3 | 33.0 | 36.0 | 38.7 | 31.7 | 43.1 | 27.3 |
| Exports to South Korea | 10.28 | 19.9 | 25.8 | 29.2 | 28.2 | 26.9 | 26.3 | 38.3 | 29.6 |
by Robert Brusca October 22, 2007
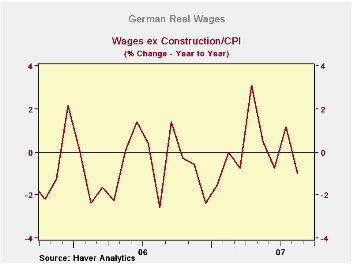
The threat to growth in Europe has been named in the past weekend’s G-7 meeting as primarily due to the strong Euro. The Euro remains a threat to growth though Germany’s finance minister was quite blasé about it in comparison to Trichet (of France and the ECB) and LaGarde (FinMin of France). Still one important factor remains, the consumer, and there the rise in energy prices remains a problem as headline inflation is eroding real wages. Real wages may not be deemed ‘growth threat number one’, but just because your picture is not framed at the top of the most-wanted list at the post office is no reason to count the risk as benign. Real wages are dropping on the sequential growth rates at an increasingly rapid pace. In the third quarter they are falling at a pace of nearly 5% annualized.
| Month-to-Month | At Saar | Saar | |||||
| Aug-07 | Jul-07 | Jun-07 | 3-Mo | 6-Mo | 12-Mo | Qtr-2-Date | |
| Wages | -2.5% | 1.1% | -0.5% | -7.4% | 0.5% | 1.0% | -2.8% |
| Inflation (CPI) | 0.1% | 0.3% | 0.1% | 1.8% | 2.7% | 2.0% | 2.2% |
| Real Wages | -2.6% | 0.9% | -0.6% | -9.0% | -2.1% | -1.0% | -4.9% |

Tom Moeller
AuthorMore in Author Profile »Prior to joining Haver Analytics in 2000, Mr. Moeller worked as the Economist at Chancellor Capital Management from 1985 to 1999. There, he developed comprehensive economic forecasts and interpreted economic data for equity and fixed income portfolio managers. Also at Chancellor, Mr. Moeller worked as an equity analyst and was responsible for researching and rating companies in the economically sensitive automobile and housing industries for investment in Chancellor’s equity portfolio. Prior to joining Chancellor, Mr. Moeller was an Economist at Citibank from 1979 to 1984. He also analyzed pricing behavior in the metals industry for the Council on Wage and Price Stability in Washington, D.C. In 1999, Mr. Moeller received the award for most accurate forecast from the Forecasters' Club of New York. From 1990 to 1992 he was President of the New York Association for Business Economists. Mr. Moeller earned an M.B.A. in Finance from Fordham University, where he graduated in 1987. He holds a Bachelor of Arts in Economics from George Washington University.
More Economy in Brief


